Overbought stocks offer many opportunities for traders. In some cases, overbought stocks are running on momentum that traders can ride for a quick profit. In other cases, overbought stocks are poised for a reversal, and traders who recognize the signs can get out in front of the direction change.
Today, we’ll take a closer look at overbought stocks and explain how to use Scanz to create an overbought stock screener.
What Makes a Stock Overbought?
A stock is said to be overbought when its current price value is higher than it ‘should’ be based on your analysis. You might consider a stock overbought, for example, if it is trading well above it’s prior 52-week high or above its most recent resistance level. Alternatively, a stock could be considered overbought based on fundamental metrics – say, if its price is significantly higher than the calculated book value of the stock.
No matter what factors you use to designate a stock as overbought, it’s important to remember that this decision is a subjective interpretation of value. Often, traders use multiple indicators and other pieces of information to determine whether a stock is overbought, and there may be conflicting signals.
In many cases, a stock being overbought is a sign that buying enthusiasm will soon diminish, because the now high price is no longer justified. In that case, you can expect that the price trend will reverse and move downward.
However, a stock can also be overbought because of high enthusiasm around the company. In this case, a stock being overbought is a bullish signal. Many growth stocks are considered overbought for years at a time based on technical indicators. But that doesn’t necessarily mean that a price reversal is impending.
How to Scan for Overbought Stocks
You can scan fore overbought stocks with a variety of technical metrics using the Pro Scanner module in Scanz. There are dozens of different ways to set up overbought stock screeners, so we’ll focus on some of the most commonly used indicators for this purpose.
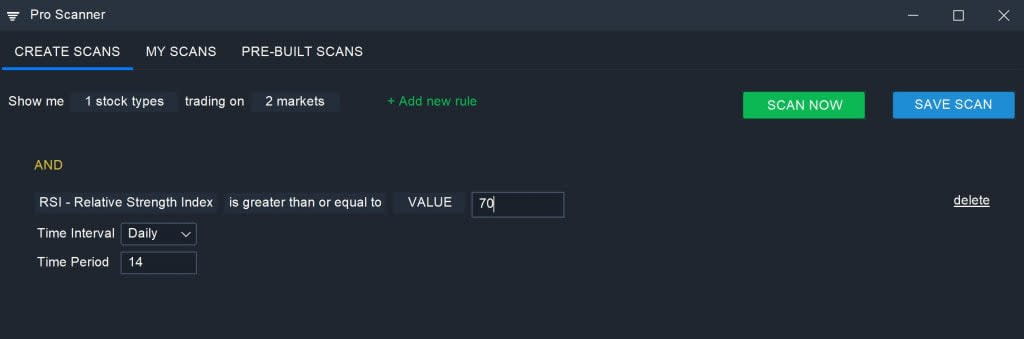
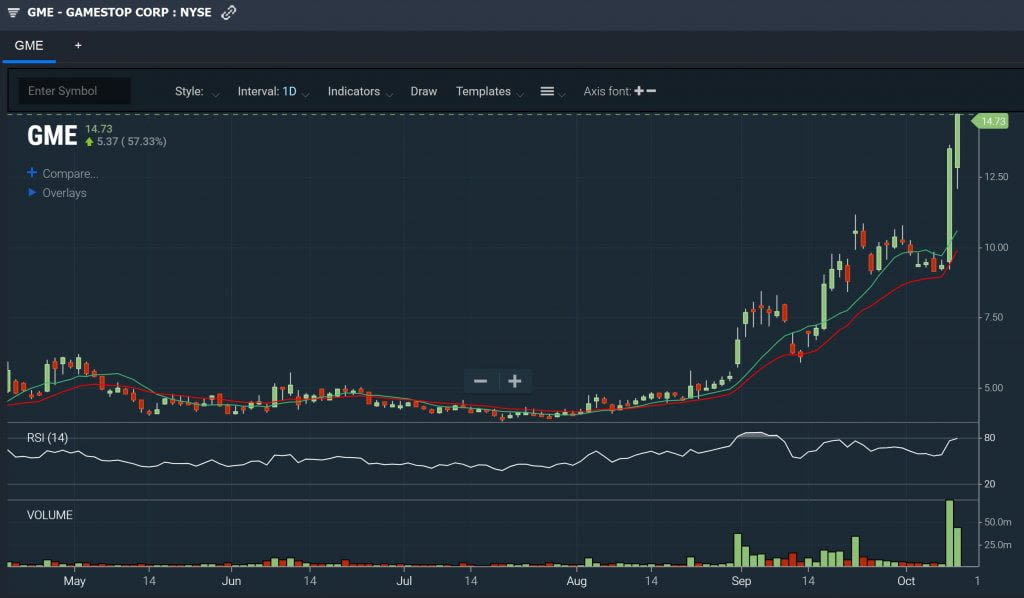
First, almost every overbought scanner will rely on RSI. This momentum indicator has a relatively simple interpretive framework – when the RSI value for a stock is over 70, it is considered overbought. Some traders use a cutoff of 80, which indicates even more extreme price conditions. RSI often isn’t robust enough to trade in the absence of other information, but it’s a good place to start when building an overbought screener.
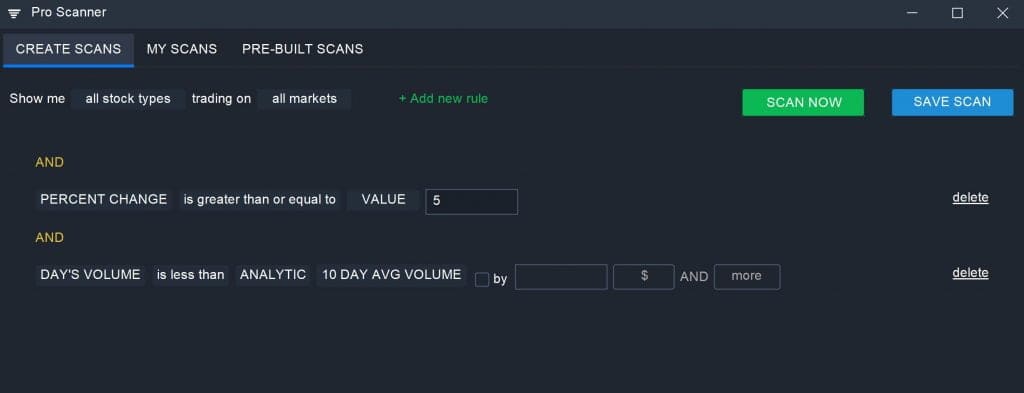
Another metric you can use to find overbought stocks is Percent Change, which measures a stock’s gain or loss on the day. Looking for stocks with a relatively high gain, say 5% or greater, can help you find stocks that are overbought on the day. If you use Percent Change, be sure to check on trading volume as well. Low trading volume paired with a large intraday gain often signals waning momentum, which could result in a reversal.
You can also look for stocks that are trading well above their 52-week lows:
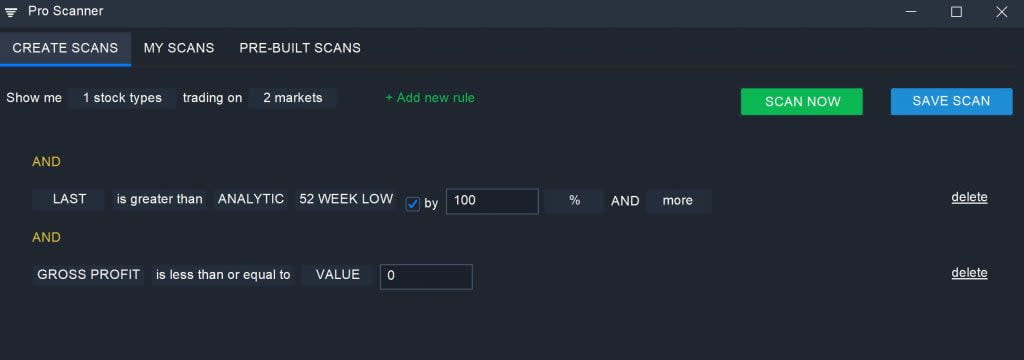
LAST is greater than ANALYTIC 52 WEEK LOW by 100% AND More
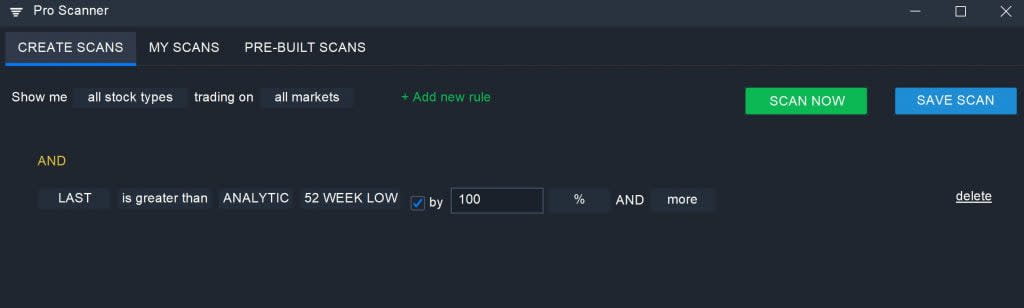
This allows you to screen specifically for stocks that have seen significant price gains within the past year, which may continue or peter out in the future.
You can also use fundamental metrics to find companies that are likely overvalued in addition to being overbought. For example, you can look for companies that are posting major stock gains despite having a negative bottom line:
LAST is greater than ANALYTIC 52 WEEK LOW by 100% AND More
AND
GROSS PROFIT is less than VALUE 0
It’s a good idea to combine multiple of these metrics when building your own overbought stock screener. Creating more strict or more relaxed cutoffs can also narrow or broaden your results in different market conditions.
How to Trade Overbought Stocks
Once you’ve identified an overbought stock, you need to decide on a strategy for trading it. There are several different ways you can go about this depending on the stock’s characteristics.
For overbought stocks that are losing momentum or are highly overvalued relative to fundamental data, you could short sell the stock. It’s a good idea to identify a support level to set a price target for your trade. You may also want to wait for a reversal signal before opening your position.
For stocks that are likely to continue climbing in the future but losing momentum in the short-term, you can wait for a pullback before buying into the stock. Rather than try to perfectly time the bottom of the pullback, wait until the upward trend reestablishes itself before entering a bullish position.
Not every overbought stock will fall in value in the near-term. Many momentum stocks can be considered overbought, but they are likely to continue rising in value. In this case, you can ride the momentum upward and exit your position as soon as momentum begins to fade. Look to diminishing trading volume as a sign of this fade.
Conclusion
Overbought stocks are a prime target for traders who can accurately evaluate whether a stock is likely to reverse or continue pushing higher. Whenever analyzing overbought stocks, keep in mind that the very idea of a stock being overbought is subjective. There is no single metric that can tell you whether a stock is overbought, so it’s important to incorporate multiple indicators into your overbought stock screener and trading analysis.
Related Reading:
- RSI Stock Screeners: Measuring Overbought Conditions
- Bollinger Bands Scan: Spotting Price Extremes
- Stochastics Scanners: Overbought Signals in Range-Bound Markets
Ready to start scanning? Try for free and choose the plan that fits your workflow.