Over-the-counter (OTC) stocks are stocks that aren’t listed on one of the major stock exchanges, like the NYSE or Nasdaq. Many OTC stocks are “penny stocks,” companies that have very low market capitalization, although there are a number of blue-chip foreign stocks that trade on OTC markets as well.
Let’s take a look at some of the advantages and disadvantages to trading OTC stocks and how you can scan for OTC stocks that are ready to pop using Scanz.
Pros and Cons of Trading OTC Stocks
OTC stocks don’t see nearly the trading volume of the major US stock exchanges, which brings with it some risks and opportunities.
First, it’s important to understand that many companies list on OTC markets to avoid regulatory scrutiny. Companies traded OTC aren’t required to release key financial information and don’t typically have a lot of transparency. That means that you may not be able to get fundamental data about particular companies and that there’s no guarantee that the data you do find is accurate. For this reason, you should be highly skeptical of companies that look too good to be true and be wary of scams.
Second, OTC stocks typically have very low liquidity compared to stocks traded on major exchanges. This means that you may have difficult entering a favorable position when trading a stock that’s primed for a big price increase or exiting your position at your desired level. Be cautious when trading OTC stocks and leave room for slow order fulfillment.
That said, the lack of institutional interest in OTC stocks means that there is a lot of potential for profit. Whereas few companies on the major exchanges are “undiscovered” by traders, there truly are promising companies that may have been overlooked by other traders on the OTC markets. Many companies listing OTC are startups with promising business models or new technologies. Trading OTC stocks provides a way to get in on the ground floor of these companies.
In addition, retail investors have much more sway in OTC markets. It’s possible for small amounts of money to purchase relatively large numbers of shares. At the same time, small bits of news (or speculation) can create large swings in prices that traders can profit from.
Keep in mind that there are some large foreign companies, like Nestle and Bayer, that also trade OTC as a way of avoiding having to report to the US SEC. These stocks do have institutional investors and are heavily regulated in their home markets. Many of the warnings that apply to small OTC stocks do not apply to these companies.
Finding Hot Penny Stocks
Scanning for OTC Breakouts
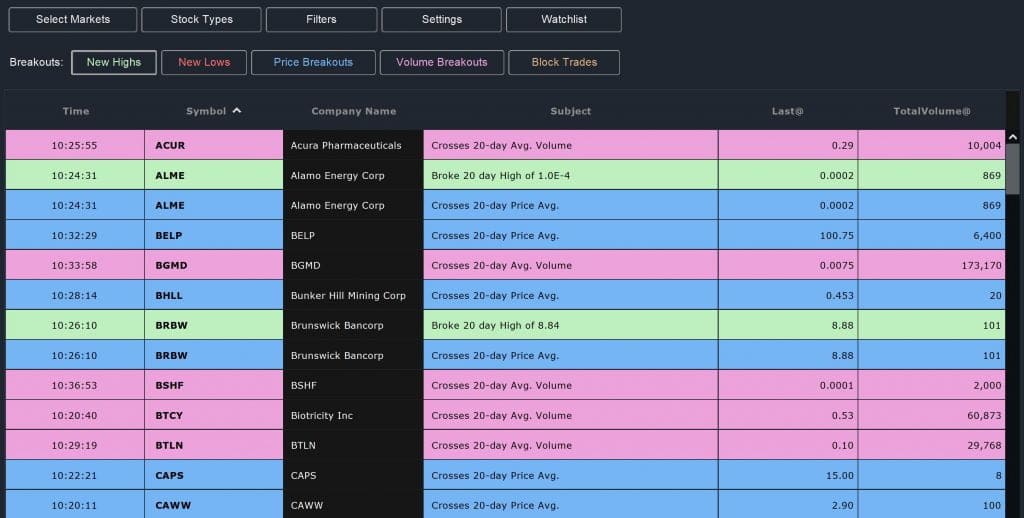
The best place to start looking for hot OTC stocks is with Scanz’s Breakouts module. Simply limit the markets filter to OTC Markets and select your filter parameters – new 52-week highs, price breakouts above the 20-day moving average, and volume breakouts above the 20-day average daily volume are good places to start. You may also want to use the price range, market cap, or volume filters to limit your scan to only the most reputable OTC stocks.
Finding OTC Stocks Using the Easy Scanner
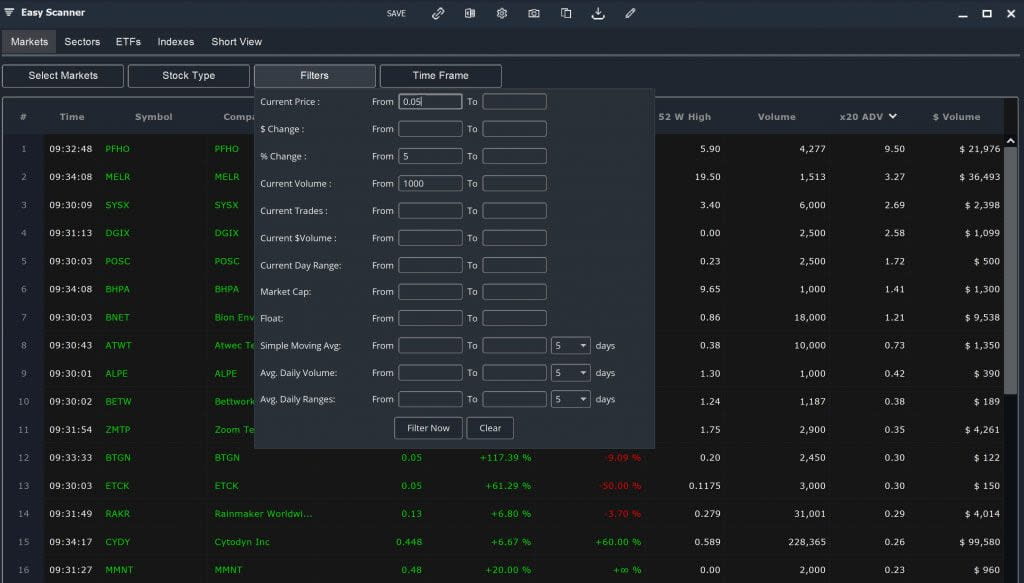
The Easy Scanner offers another fast and simple way to find OTC stocks that are punching above their weight. Limit your scan to OTC Markets, then add in a filter for % Change such as From 5%. That will scan only for stocks that are rising rapidly on the day. You can add in additional filters for volume, price, or market cap to narrow down your scan results.
For more information about the scan results, make sure you have the % Change, % Change 5 Day, 52-week High, Volume, and Average Daily Volume columns enabled. That way, you can get a broader sense of which hot OTC stocks are worth a closer look.
OTC Top Performers
For more targeted scans, you can use the Pro Scanner to look for specific bullish trading setups. Keep in mind that you’ll want to once again select only OTC Markets, and that you may want to limit your scan to stocks above a particular price, volume, or market cap threshold.
A good place to start searching for bullish OTC stocks is to scan for the top performing stocks over the past few months. There are a couple different ways to define this long-term performance, but one of the simplest options is to simply look for stocks that are far above their 52-week low and for which all the moving averages are increasing:
PREV DAY CLOSE is greater than ANALYTIC 52 WEEK LOW by 2X AND More
AND
Simple Moving Average (Daily, 10) is greater than ANALYTIC Simple Moving Average (Daily, 50)
AND
Simple Moving Average (Daily, 50) is greater than ANALYTIC Simple Moving Average (Daily, 200)
You can hone this performance scan more by setting thresholds for the increase in the more recent moving averages or by looking for stocks that are currently setting a new 52-week or shorter-period high.

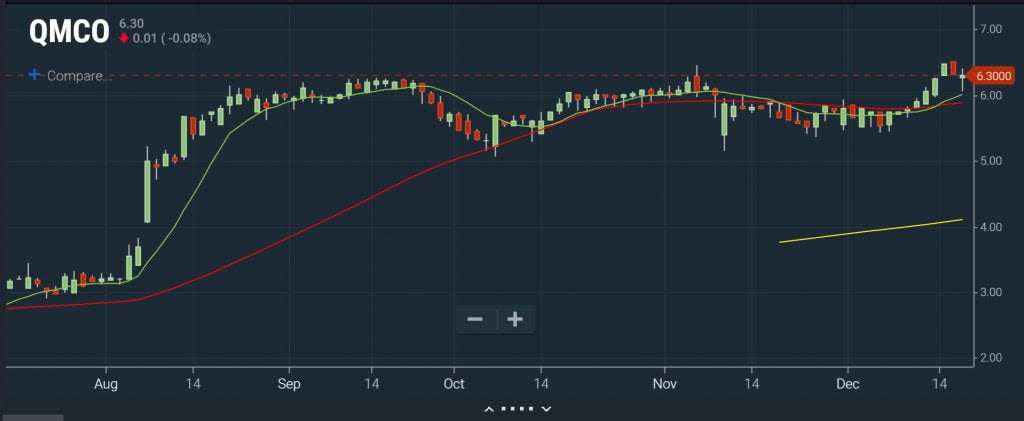
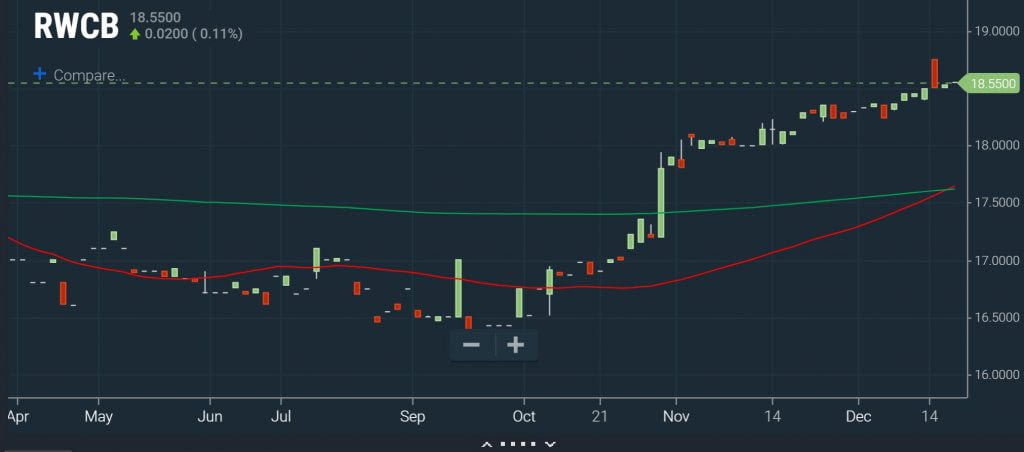
OTC Golden Cross
If you want to hone in on OTC stocks that are poised for a big price movement right now, scanning for Golden Cross patterns can help. A Golden Cross occurs when the 50-day moving average crosses above the 200-day moving average. It’s typically considered a very bullish pattern, especially when combined with an MACD cross or another technical signal.
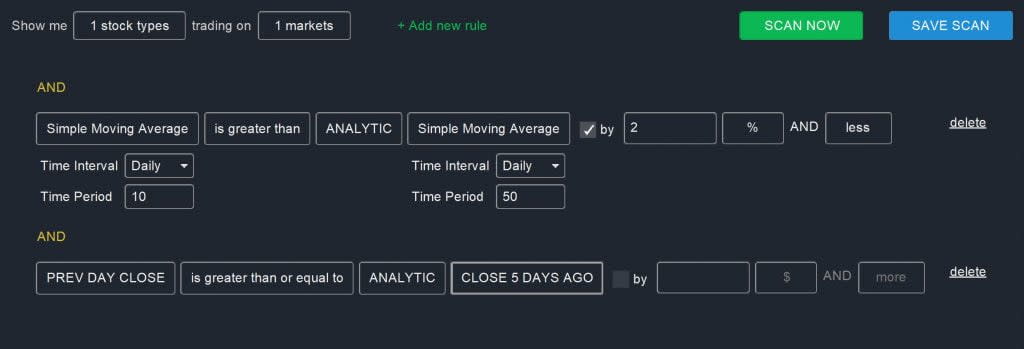
You can look for this pattern using this scan:
Simple Moving Average (Daily, 50) is greater than or equal to ANALYTIC Simple Moving Average (Daily, 200) by 2% AND less
AND
PREV DAY CLOSE is greater than ANALYTIC CLOSE 5 DAYS AGO
It’s helpful to include the 2% and less parameter here so that you’re only looking at Golden Cross patterns that occurred within the past several days. The second rule eliminates stocks for which the 50-day moving average is declining towards a lower 200-day moving average rather than increasing past it.
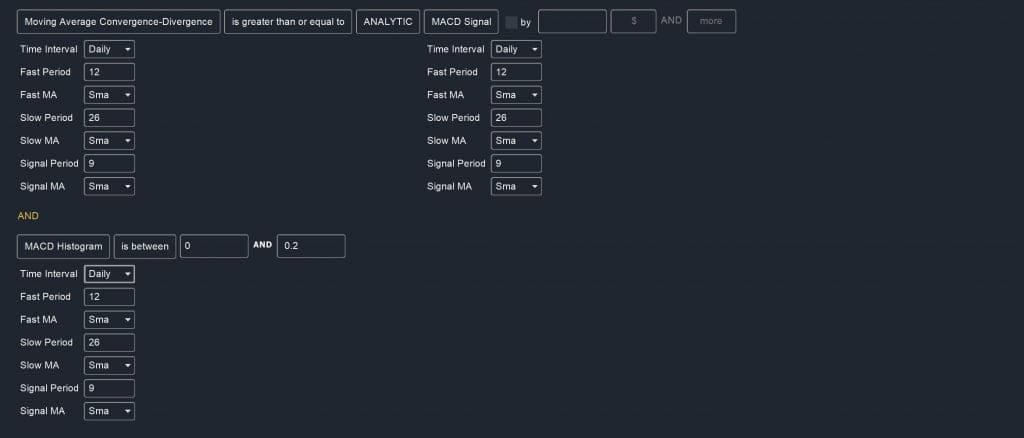
If you want to combine this scan with filters for an MACD cross, add in these two rules:
Moving Average Convergence-Divergence is greater than or equal to ANALYTIC MACD Signal
AND
MACD Histogram is between 0 AND 0.2
This scan points to stocks that have a lot of bullish momentum behind them. Be sure to check on trading volumes to make sure that the momentum is likely to be sustained.
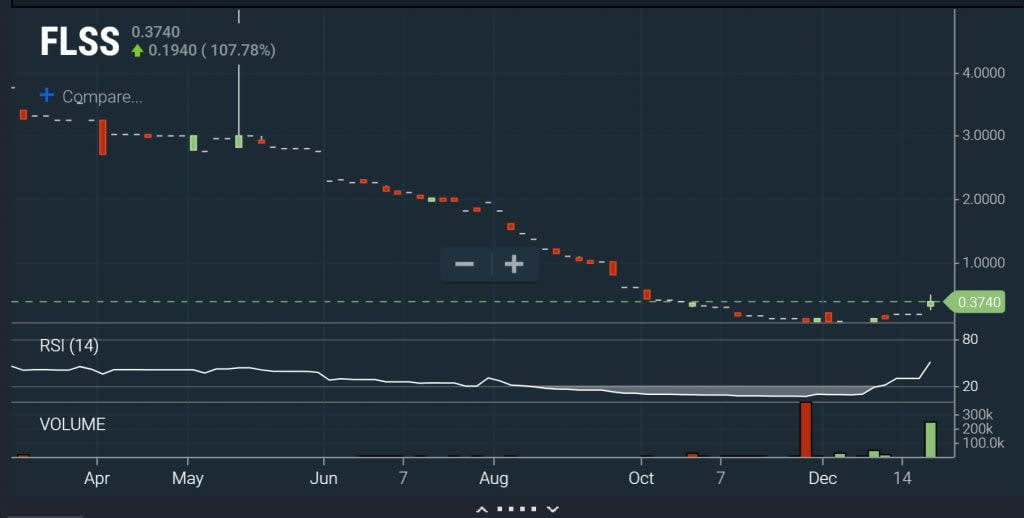
Oversold with Volume
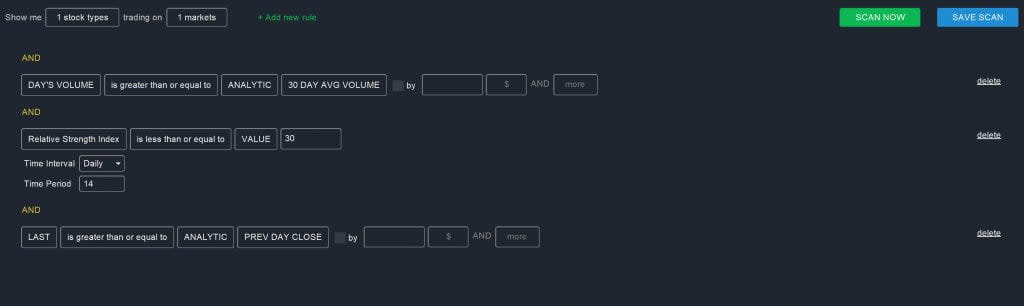
One additional scan that can help you find immediate buying opportunities looks for stocks that are bouncing back from a recent low with strong volume. Since OTC stocks tend to trade with low volume, unusually high volume can be a very good sign of strength. In this case, looking for stocks that are already oversold (based on RSI) allows you to spot when an upward trend may be kicking off.
DAY’S VOLUME is greater than or equal to ANALYTIC 30 DAY AVG VOLUME
AND
Relative Strength Index (Daily, 14) is less than or equal to VALUE 30
AND
LAST is greater than or equal to ANALYTIC PREV DAY’S CLOSE
You’ll want to be careful when using this scan to make sure that the price is bouncing off a bottom, rather than that a stock is moving to new lows on strong volume.
Conclusion
OTC stocks can be risky, but they also hold a ton of potential for profit since there aren’t nearly as many traders combing through them for opportunities. When scanning for OTC stocks using Scanz, it’s always a good idea to set market cap, volume, or price thresholds to help ensure you’re looking only at legitimate companies. Always do your research into OTC stocks before trading them, as there are plenty of stories of scams and inflated valuations among OTC traders.
Related Reading:
Ready to start scanning? Try for free and choose the plan that fits your workflow.