Trading volume is an extremely important metric for day and swing traders to take advantage of. Volume provides information about the interest in a stock and the likelihood of a breakout continuing or reversing. On top of that, trading volume can be used as a way to confirm other technical patterns and to ensure that a stock has enough liquidity before entering a tight position.
Given the importance of trading volume, it’s essential that traders have a way to quickly identify stocks that are trading well above or well below their normal volume. Scanz offers several different ways to help you scan for abnormal volume.
Using the Breakouts Module
The best place to start when searching for stocks with unusually high volume is the Scanz Breakouts module. Here, it’s easy to use the Volume Breakouts filter to quickly limit your scan to just stocks that are trading with higher than average volume. You can further hone your scan by setting volume ranges, or a market cap range.
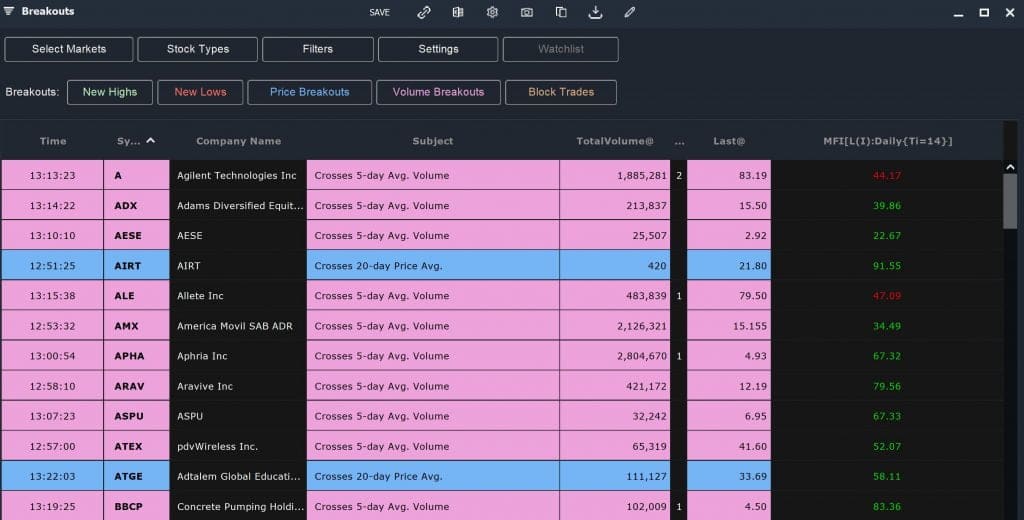
If you use the Breakouts module to look for volume, it’s a good idea to also turn on the Price Breakouts filter and then sort by the Symbol column. That way, you can quickly find stocks that are experiencing above-average volume on a bullish run – a good sign of potentially profitable momentum. Add in the News column as well to see if there are news alerts that may be causing the stocks in question to rise.
Using the Pro Scanner
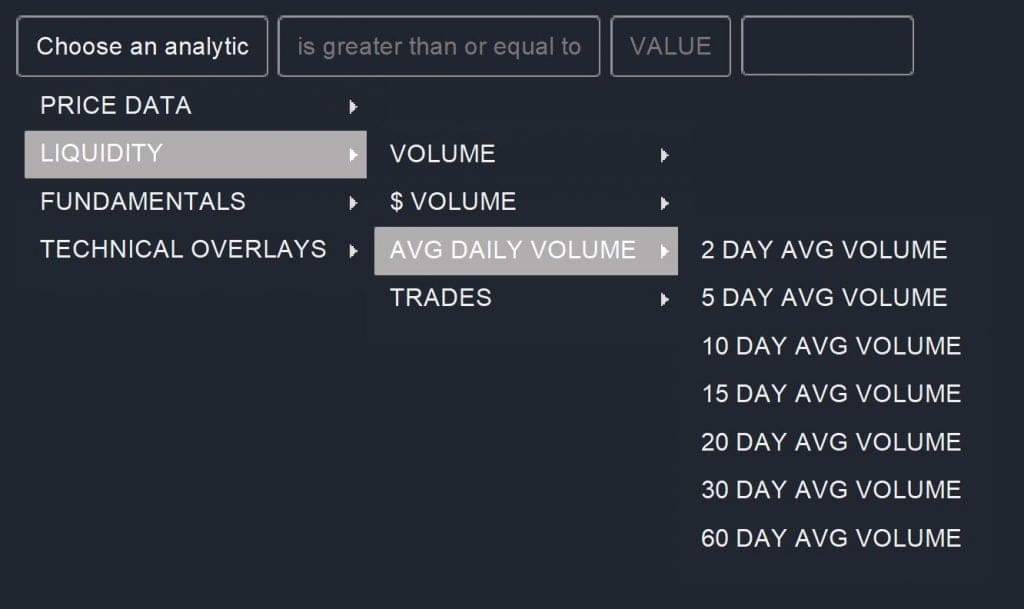
The Pro Scanner offers more flexibility to combine your scan for a volume breakout with other technical indicators. To start, let’s take a look at the volume metrics available in the Pro Scanner:
- **Volume **– Today’s or yesterday’s volume, as measured in total shares traded.
- **$Volume **– A measure of volume as the total dollar value of shares traded. $Volume allows you to normalize your scan results by share price, since more expensive shares will trade with overall lower share volume than less expensive shares.
- **Avg Daily Volume **– A simple moving average of share volume over the past several days. This moving average is what you’ll be comparing against when looking for abnormal volume activity.
- **Trades **– A measure of volume as the number of individual trades executed for a stock. This is good to check to make sure that volume and dollar volume are not being driven by a few institutional investors rather than broad trading interest.
You’ll find all of these metrics under Liquidity within the Pro Scanner.
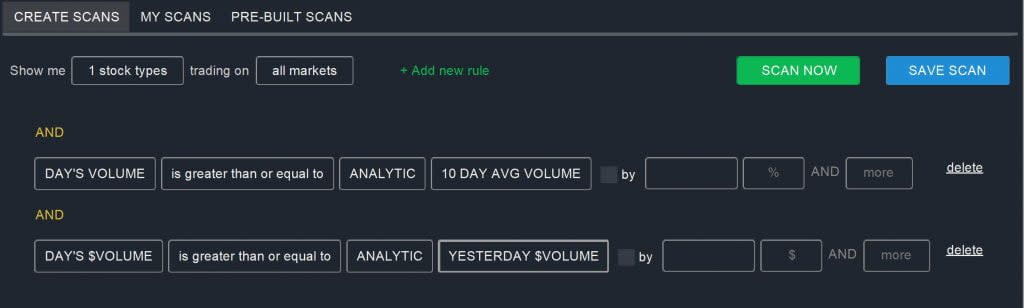
With that in mind, scanning for abnormal volume starts with comparing the current day’s volume against the average daily volume:
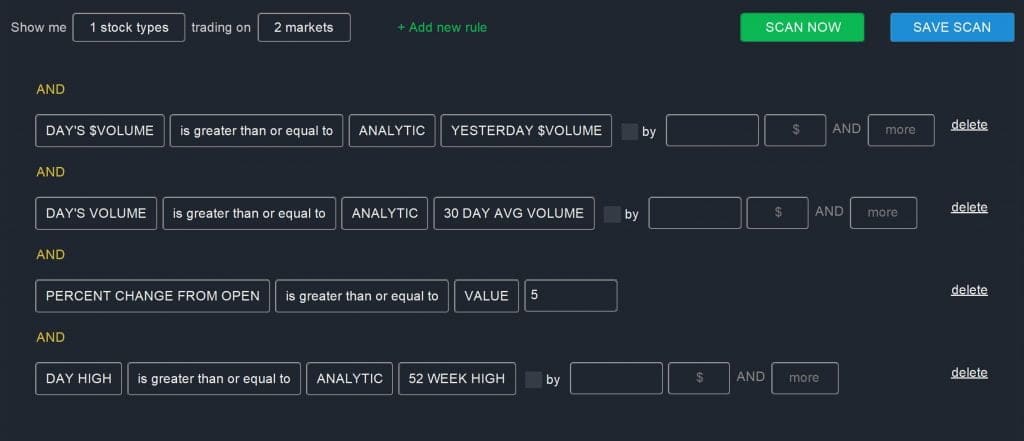
DAY’S VOLUME is greater than or equal to ANALYTIC 10 DAY AVG VOLUME
You can shorten or extend the daily volume average according to what kind of trading activity you’re looking for, or set the “by” parameter to create a cutoff for how abnormally high the current trading volume has to be to show up in your scan results.
If you use a short average daily volume timeframe, it’s also a good idea to normalize for short-term changes in stock prices using the $Volume parameter:
DAY’S $VOLUME is greater than or equal to ANALYTIC YESTERDAY’S $VOLUME
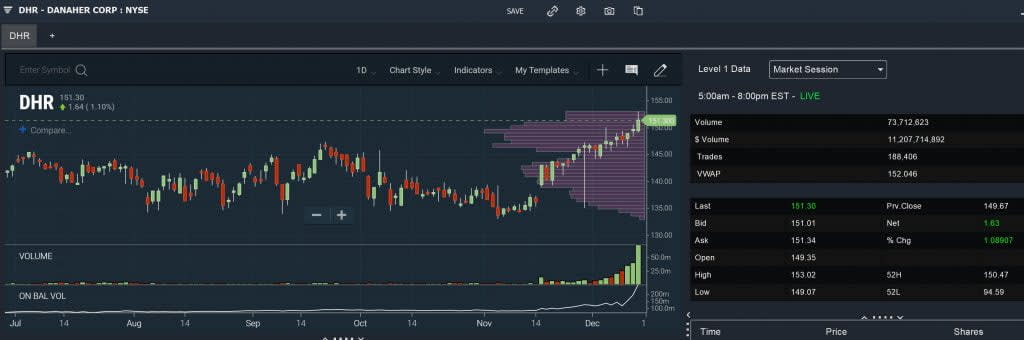
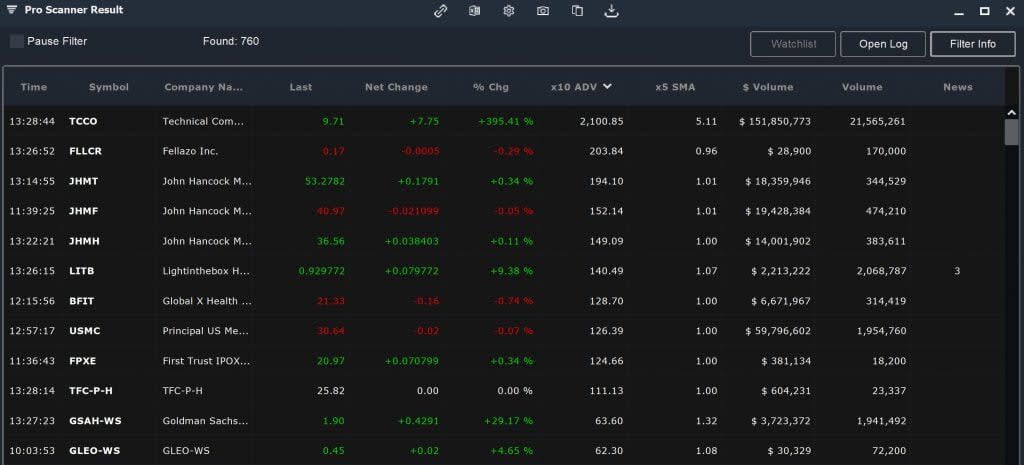
Within the scan results, you’ll want to set up your window to display detailed volume information as well as information about a potential price breakout. For example, you can turn on the News, $Volume, and Average Daily Volume columns, as well as the Simple Moving Average column. If you sort by Average Daily Volume Multiple, it’s easy to see which stocks are sporting the most significant volume breakouts relative to normal.
Enhancing Your Volume Scans
Scanning for abnormal trading volume using the Pro Scanner is powerful on its own, but you’ll get even more actionable information by coupling a volume scan to other types of scans. Here are a few different specific trading situations that you can spot by pairing your abnormal volume scan with other metrics.
Momentum Stocks
Abnormally high volume is often a signal that a big move is being supported by traders. You can narrow your abnormal volume scan to just stocks that are running on momentum by adding in price data to your scan. For example, you can use the Percent Change from Open filter to show stocks that have been accumulating momentum – both in price and volume – throughout the day. Alternatively, look for stocks that have broken through a price benchmark, such as the 52-week high, with strong volume:
DAY HIGH is greater than or equal to ANALYTIC 52 WEEK HIGH
These supported price breaks offer a good chance for intra-day or intra-week momentum trading.
Swing Trades
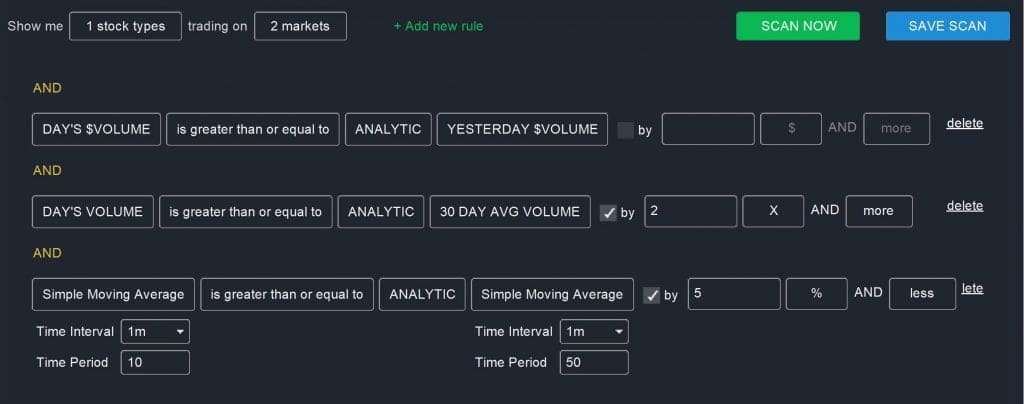
You can also scan for stocks with abnormally high volume as a way to identify potential swing trades. In this case, you’ll want to look for a moving average crossover that is accompanied by high volume. The best way to look for a moving average crossover is to scan for a short-term moving average that is only slightly higher than the long-term moving average:
Simple Moving Average (Daily, 10) is greater than or equal to ANALYTIC Simple Moving Average (Daily, 50) by 5% and Less
Breakouts and Breakdowns
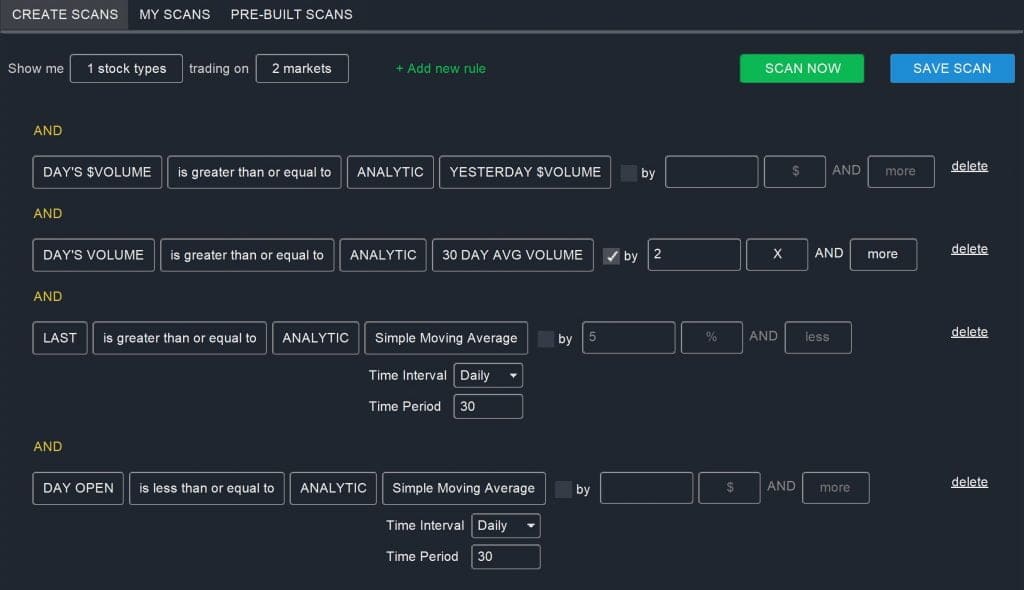
There are a number of different ways to scan for breakouts and breakdowns that are supported by volume. One of the simplest is to look for stocks that have broken through a moving average with high trading volume:
LAST is greater than or equal to ANALYTIC Simple Moving Average
AND
OPEN is less than or equal to ANALYTIC Simple Moving Average
These are just a few examples of ways you can use an abnormal volume scan as the foundation of a more targeted stock scan. Keep in mind that you can easily customize these scans to look only at stocks in your price range or within a certain market cap range as well.
Using Scanz to Quickly Identify Volume Breakouts
Scanz allows you to scan for stocks trading with abnormally high volume using either the Breakouts module or the Pro Scanner module. Whichever you choose, it’s easy to filter for stocks that are trading above their average daily volume and to pair this data with information about price breakouts and trends. The Pro Scanner in particular allows you to combine a volume breakout scan with other momentum and price trend scans, which makes it a valuable tool for identifying opportunities to trade a well-supported trend.