Triangle patterns are a chart pattern commonly identified by traders when a stock price’s trading range narrows following an uptrend or downtrend. Unlike other chart patterns, which signal a clear directionality to the forthcoming price movement, triangle patterns can anticipate either a continuation of the previous trend or a reversal. Although triangles more frequently predict a continuation of the previous trend, it is essential for traders to watch for a breakout of the triangle before acting on this chart pattern.
Triangle Patterns
A triangle pattern forms when a stock’s trading range narrows following an uptrend or downtrend, usually indicating a consolidation, accumulation, or distribution before a continuation or reversal.
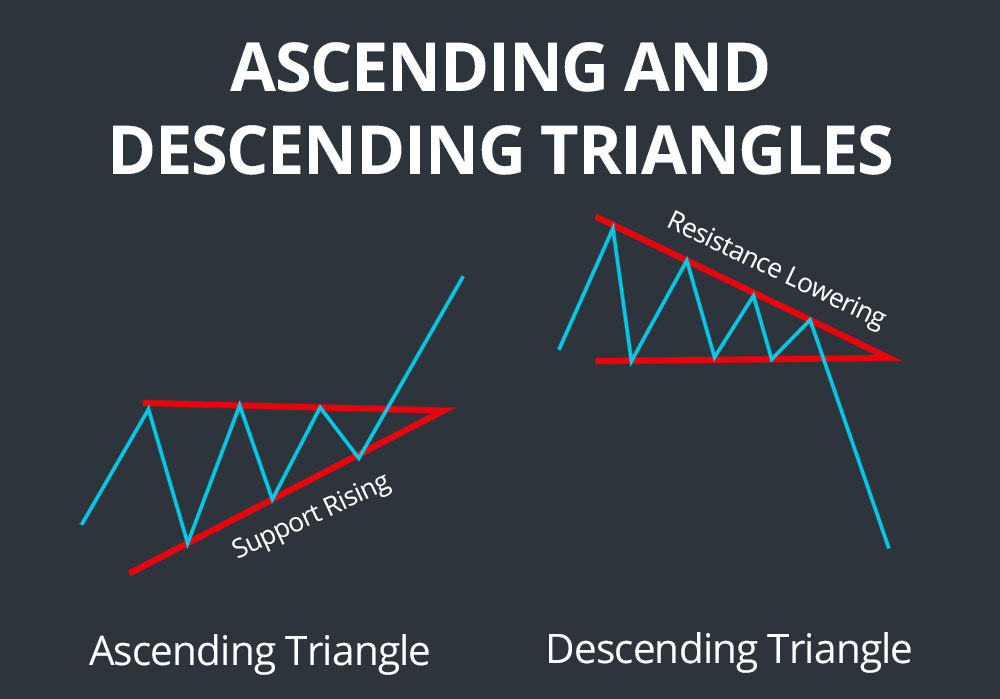
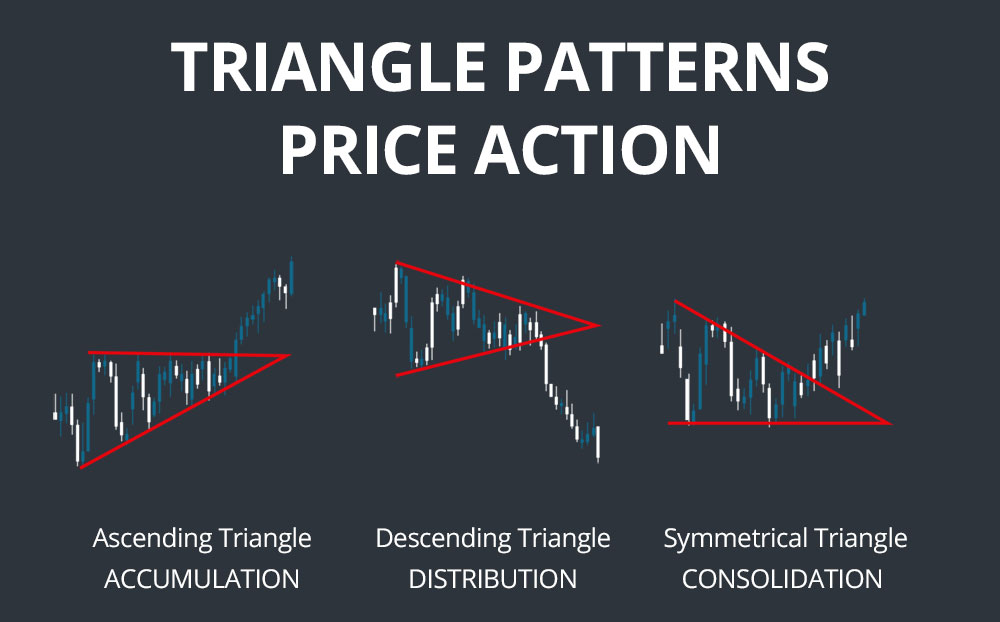
Triangle patterns come in three varieties – ascending, descending, and symmetrical – although all three types of triangles are interpreted similarly.
Ascending and Descending Triangles
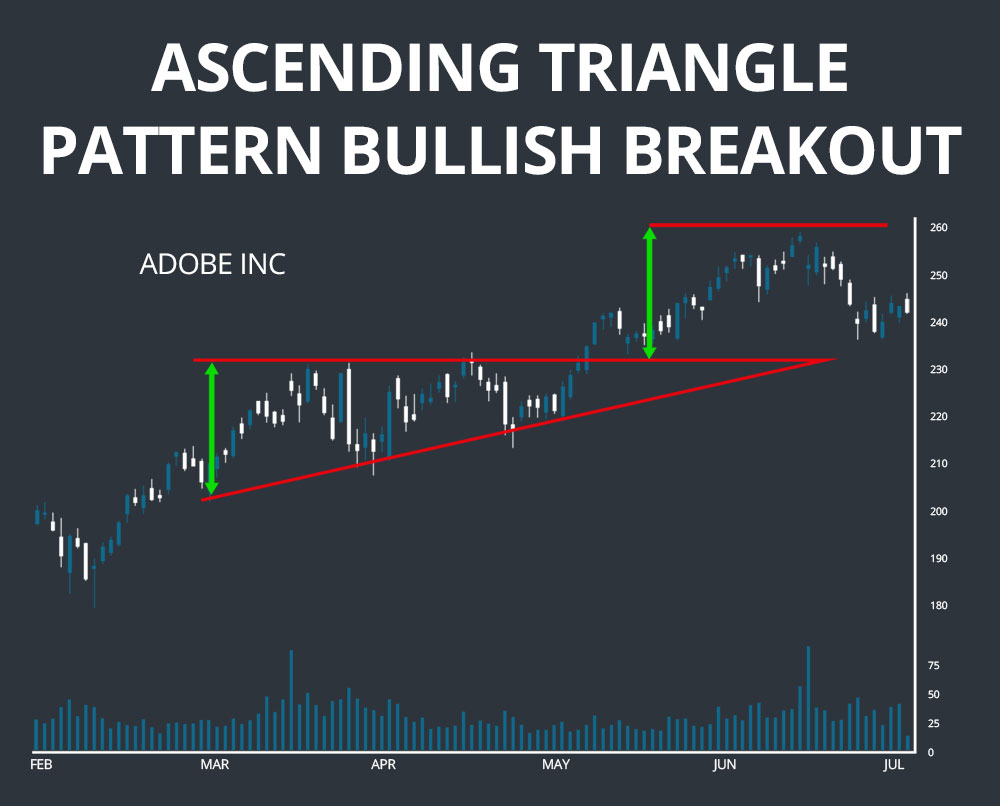
Ascending and descending triangle patterns are right-angle triangles in that the line extending along two or more lows or two or more highs, respectively, is horizontal. Ascending triangles have a rising lower trendline as a result of accumulation and are always considered bullish signals regardless of whether they form after an uptrend or downtrend. Descending triangles have a falling upper trendline as a result of distribution and are always considered bearish signals.
Symmetrical Triangles
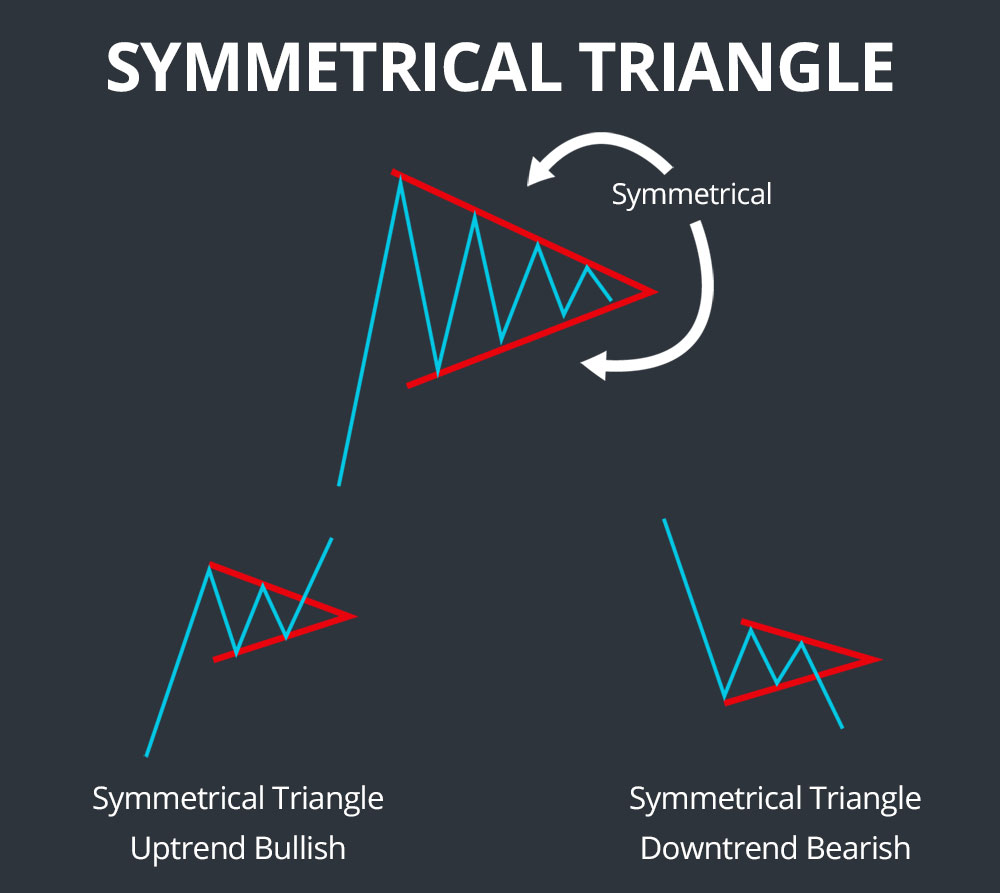
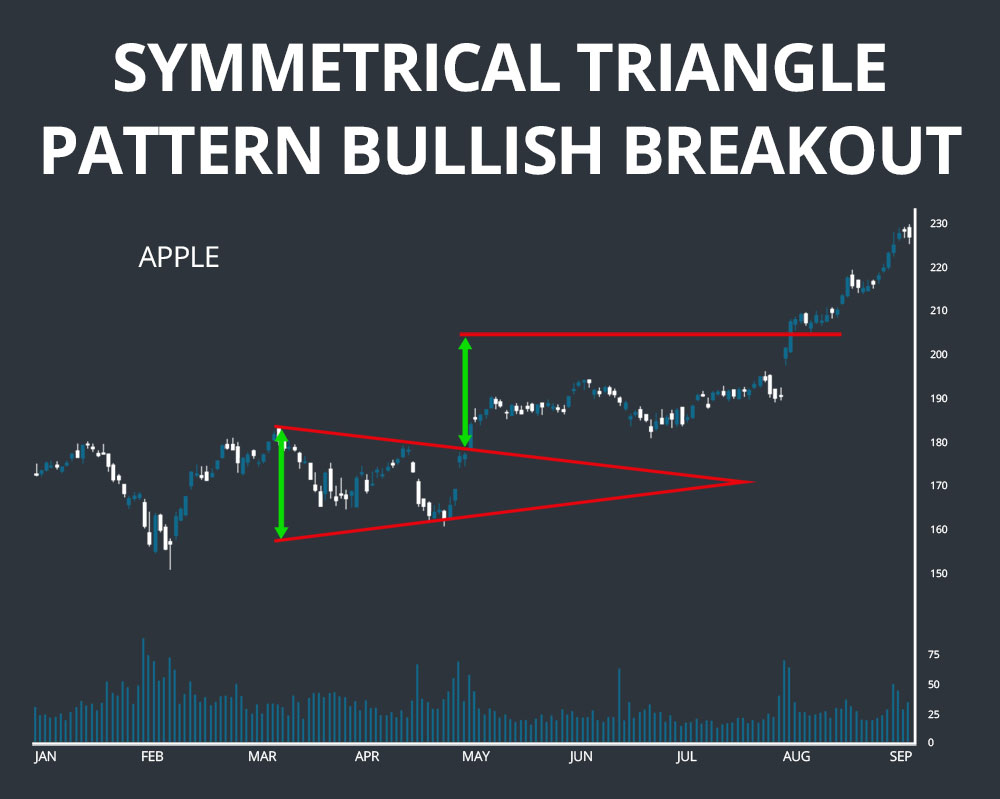
Symmetrical triangles have descending highs and ascending lows such that both the upper and lower trendlines are angled towards the triangle’s apex. Symmetrical triangles are a sign of consolidation and usually result in a continuation of the prior trend, although they can also indicate reversals.
Triangle Pattern Timescales
Triangle patterns are most commonly applied on daily charts and interpreted over a period of several months. For example, strong triangle patterns on daily chart require a prior trend that is at least a few months old and typically develop for several months before a breakout occurs. However, triangle patterns can also be observed and used for trading on shorter timescales, although doing so leaves the drawing of the triangle patterns up to a greater degree of interpretation.
Triangle Patterns Simplified
Triangle patterns work because they represent underlying patterns of consolidation (symmetrical triangles), accumulation (ascending triangles), or distribution (descending triangles). In symmetrical triangles, both bullish and bearish traders are evening out and testing the price of a stock following a significant price trend until eventually either bulls or bears win out – with the result usually following the lead of the previous trend. In an ascending triangle, buyers continue to get more aggressive over time – resulting in a rising lower trendline as subsequent lows increase – until they eventually win out over bearish traders and the stock price breaks out. The opposite action occurs in a descending triangle, where sellers are becoming more aggressive and driving consecutive highs lower until the stock breaks out bearishly.
How to Trade Triangle Patterns
A symmetrical triangle requires at least four points – two highs, where the second high is lower than the first, and two lows, where the second low is higher than the first. In ascending triangles the highs are the same across the triangle rather than descending, while in descending triangles the lows are the same across the triangle rather than ascending.
For a triangle to exist, there must be a well-established prior trend: for example, one that is at least a few months old when looking at a daily chart.
For all three types of triangle patterns, drawing a line from the first high to the second and continuing it while drawing a line from the first low to the second and continuing should form a triangle as the two lines intersect. The triangle pattern identification is more supported as more high and low points are added to the lines. As the stock proceeds further into the triangle pattern over time, volume should also diminish.
Triangle patterns typically last for anywhere from one months to three months or more on a daily chart before a breakout occurs, when the stock price moves outside the lines of the triangle. The best price action occurs when the breakout forms about halfway to three-quarters of the way to the apex of the triangle, where the triangle’s length is measured from the apex to the base of the lower trendline. A break before or after this point may be insignificant as the stock has not fully consolidated or the breakout becomes inevitable as the apex approaches.
The direction and strength of the breakout is extremely important. Although the direction of the initial break should indicate whether the previous trend will continue or reverse in a symmetrical triangle, it is important for traders to confirm the breakout before trading since triangles resulting in reversals often feature false breakouts. Strong breakouts will come with a spike in trading volume, especially for uptrends, and will move at least several percent of the price as well as last for several days.
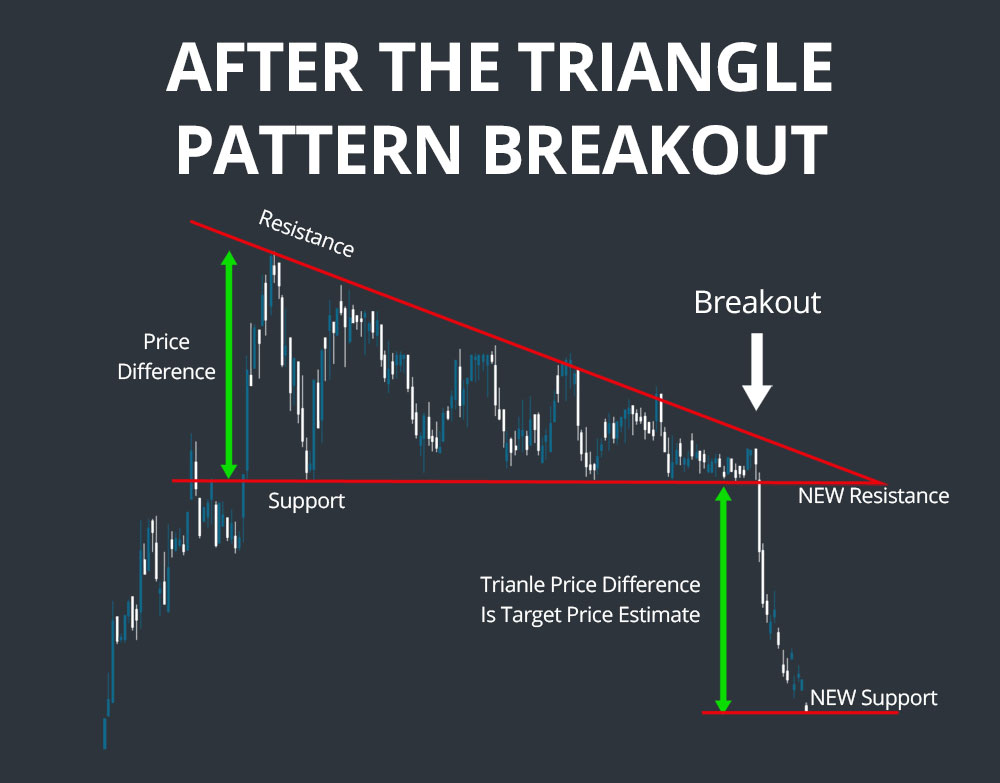
After the breakout, the apex and breakout price levels typically act as support or resistance levels. To estimate a price target on the breakout, measure the base of the triangle – the distance between the widest high and low points on the triangle – and add that to the price at the breakout point. Alternatively, draw a trendline parallel to the lower triangle line that extends from the highest high in the triangle.
Examples
The first example shows a symmetrical triangle following an extended uptrend. The lower trendline has two support points, while the upper trendline has three. The breakout occurs in the direction of the prior trend and is strong enough to provide confidence in the continuation. A secondary breakout can be seen as the stock price breaks above the price target predicted by the triangle pattern.
The second example shows a ascending triangle pattern, with three consecutive highs at a constant level and three consecutive lows increasing each time. The breakout occurs bullishly and the extent of the following uptrend is predicted almost exactly by the height of the base of the ascending triangle.
Conclusion
Triangle patterns are frequently observed following a strong, extended price trend as buyers and sellers test the new price of a stock and become more or less aggressive over time. Ascending triangles are always considered bullish signals and descending triangles are always considered bearish signals, while symmetrical triangles typically result in a continuation of the prior trend but may also signal a reversal. Triangles are highly favorable trading patterns because they are straightforward to interpret and confirm and establish support and resistance levels and a price target following a breakout.

