A stock screener is one of the best tools that traders have to identify new trading opportunities and potentially profitable setups. Technical stock screeners allow you to filter stocks according to many of the same price-dependent technical indicators that you would use on a stock chart. So, technical screeners can be extremely valuable for traders who normally trade momentum, reversal, or other short- and medium-term strategies.
In this guide, we’ll explain everything you need to know about technical stock screeners and highlight some of the common parameters that traders use with them. We’ll also walk you through building screeners for a few basic strategies in Scanz.
What is a Technical Stock Screener?
Before we dive into technical stock screeners, it’s important to understand the difference between technical and fundamental trading.
Technical trading relies on mathematical calculations, so-called “indicators,” that use the stock price, trading volume, and speed of price changes as variables. The idea behind these technical indicators is that they can to some extent predict, or at the very least suggest, what the stock price will do in the near future. A technical trading strategy is one that relies heavily on these mathematical indicators for decision-making.
This is in contrast to fundamental trading, in which traders seek to understand what a company is really worth. Usually, fundamental traders are more interested in a company’s financial statements than in changes in the recent stock price. For fundamental traders, a company is worth buying simply when it’s stock price is undervalued relative to the future predicted value of the company that stock represents.
How to Use Technical Indicators in Stock Screeners
The advantage of using technical indicators in stock screeners is that you can combine multiple indicators when sorting through stocks. Two indicators pointing in the same direction is almost always better than one, so you end up with a much more promising list of trading opportunities when building scans in a technical screener.
That said, there are some basic guidelines you should follow when using a technical stock screener. First and foremost, understand the indicators you’re using. It’s important to do a deep dive into what indicators represent and how to interpret them before adding them into a stock screen. Misinterpreting what an indicator means or underestimating its uncertainty can be costly.
Along the same lines, it’s important to be selective when building a multi-parameter stock screen. Only use technical indicators that actually add value to your screen. A good way to go about this is to think about what setups you want to look for, and then use the smallest number of indicators possible to identify only those setups.
Of course, technical stock screeners also leave plenty of room to be creative. Trying new indicators or modifying the parameters on existing indicators in your scan may help you further develop your trading strategy. Feel free to experiment as long as you are cognizant of the uncertainty in any given indicator.
Examples of Technical Stock Screeners
With all that in mind, let’s take a look at some of the most common technical indicators used for building stock screens and what they do.
Before we start, though, it’s important to highlight the importance of simple price and trading volume filters. These parameters might not seem exciting compared to more complex technical indicators, but they’re the first filters you should think about when building a new stock screen.
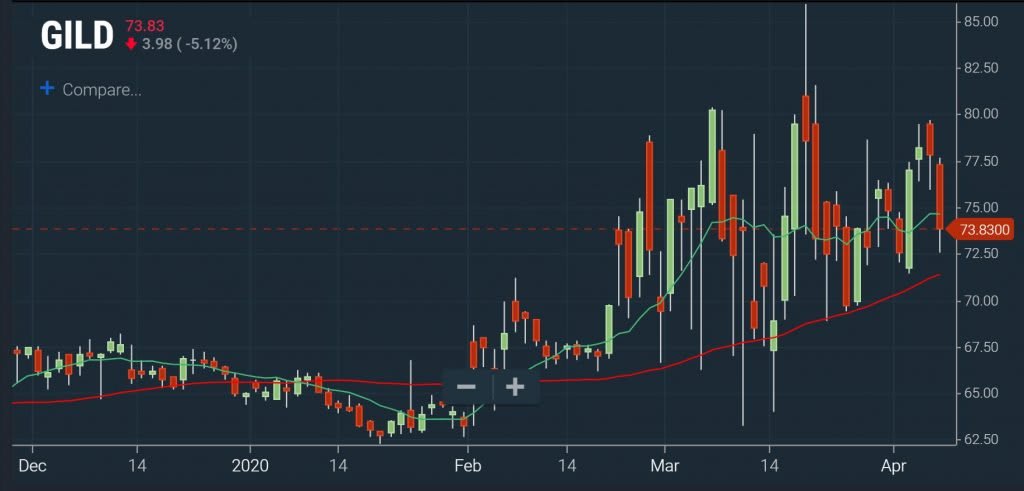
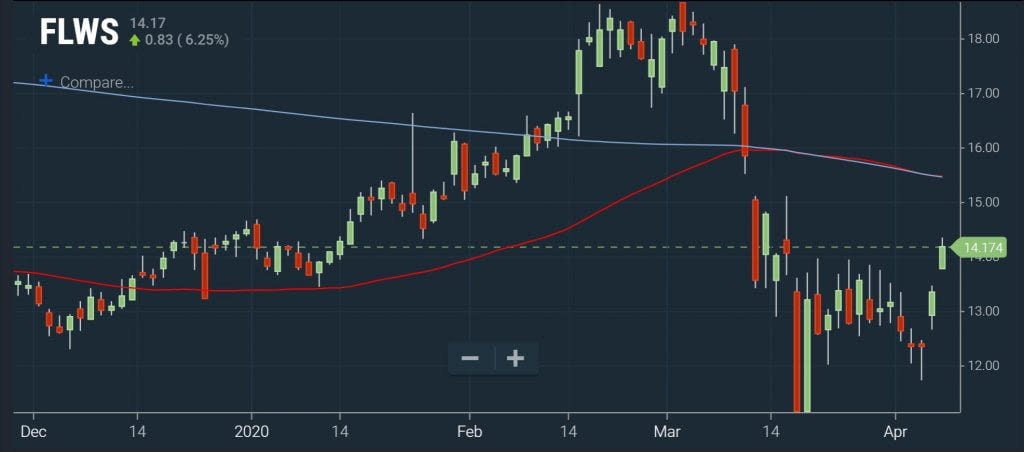
Moving Averages
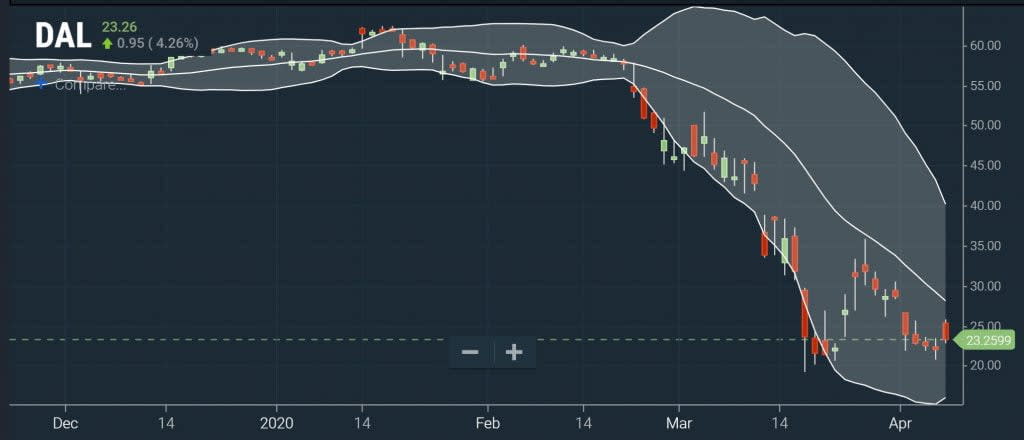
A good place to start with adding technical indicators to a stock screen is a moving average of the price. Moving averages offer information about trends in the stock price – if the moving average is increasing over time, the price has been trending up.
Importantly, to determine a trend, you’ll need to compare a short-term moving average against a long-term one. For example: 10-day moving average > 50-day moving average. In this case, the stock price has been rising faster in more recent days that in has in the past few months.
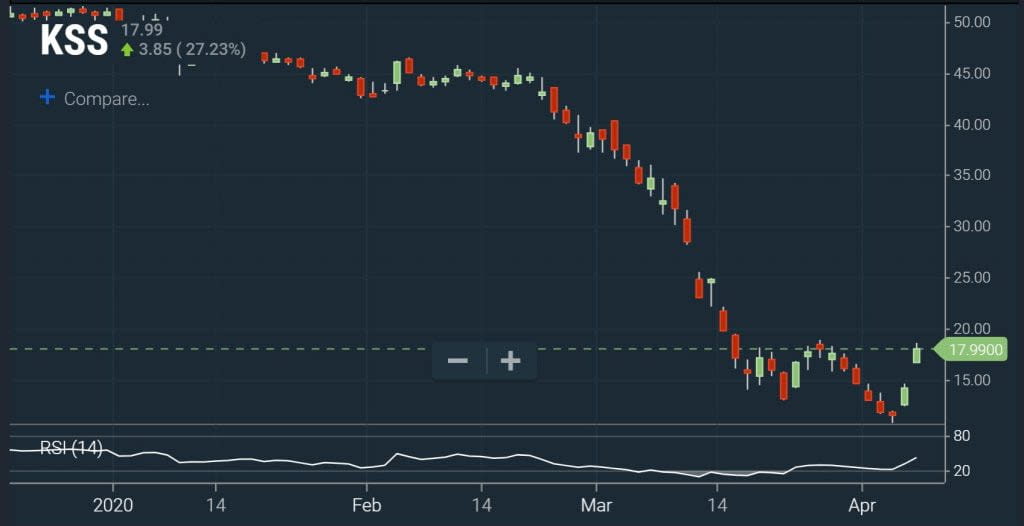
RSI
The relative strength index (RSI) is a momentum indicator. This is a nice parameter to use for technical stock screeners because it’s relatively straightforward to interpret. When the RSI is greater than 70, a stock is considered overbought; when it’s under 30, the stock is considered oversold. Of course, keep in mind that the RSI can be above 70 or below 30 for some time when a stock is trending strongly – in which case, scanning for stocks in these RSI bands can help you find stocks with a lot of momentum.
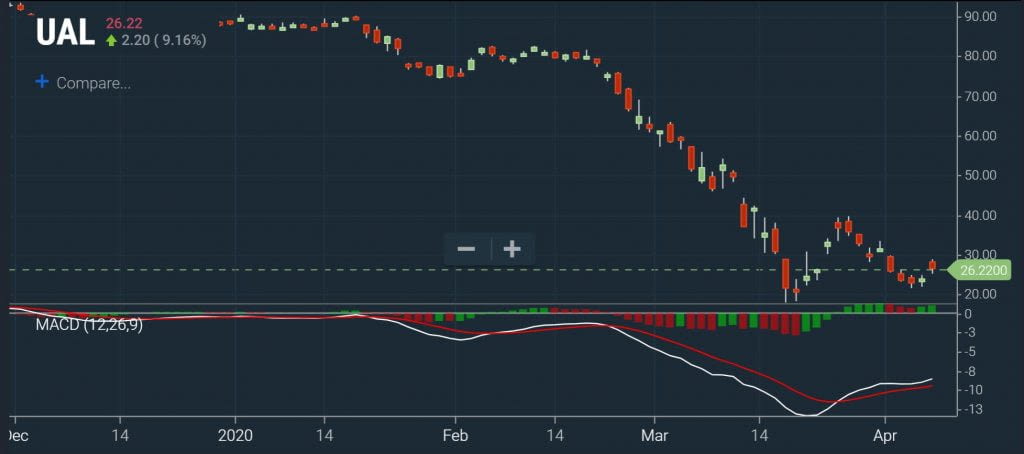
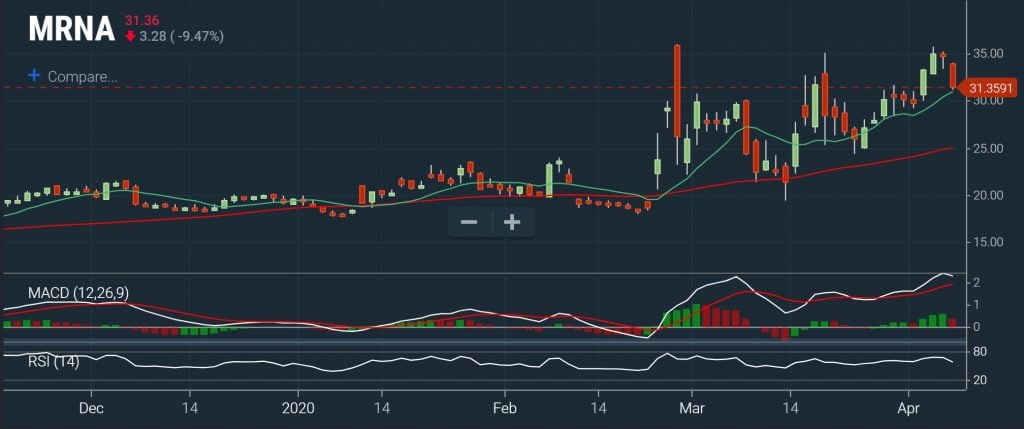
MACD
The moving average convergence-divergence is another momentum indicator, although it’s a little bit more complex than RSI. The MACD uses the relationship between a short-term and medium-term moving average to determine whether a stock is gaining or losing momentum in either the bullish or bearish direction.
The MACD has several components, but the one that you’ll want to focus on for technical stock screens is the histogram. When the histogram is positive and rising, bullish momentum is increasing. When it’s negative and falling, bearish momentum is increasing. When the histogram is positive but falling or negative but rising, this may indicate that a reversal is about to or has just taken place.
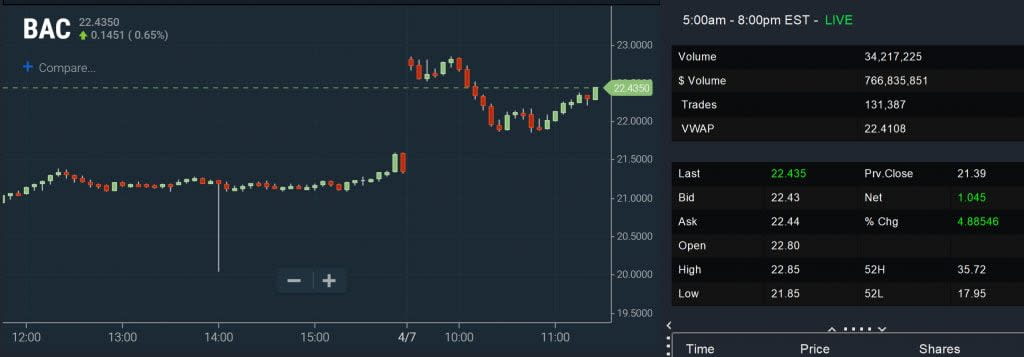
VWAP
Day traders frequently base buying and selling decisions on the volume-weighted average price (VWAP), which gives information about whether a stock is poised for a bullish or bearish move on an intraday timescale. When the VWAP crosses above the price, it’s considered a sell signal since the price is falling; when the VWAP crosses below the price, it’s considered a buy signal since the price is rising. For example, use the parameter *Price < VWAP *in a screen to find stocks that may be good intraday buys, or Last Price > VWAP and Price 5 minutes ago < VWAP to find stocks that are triggering buy signals right now.
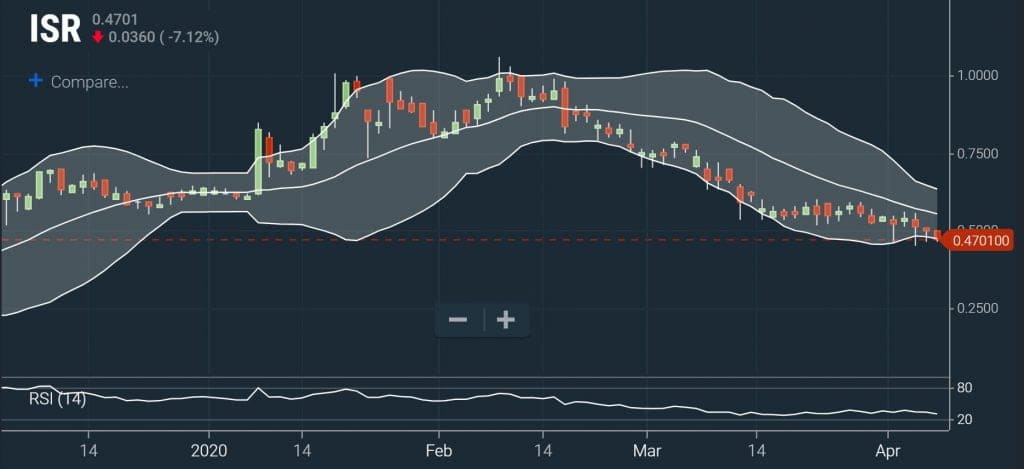
Bollinger Bands
Bollinger Bands form an envelope around the moving average of the stock price using standard deviations of the price. So, Bollinger Bands are an indicator of price volatility – they widen when volatility is high, and narrow around the current price when volatility is low.
From a screening perspective, you can use Bollinger Bands either to gauge volatility or to look for stocks that are overbought or oversold. If a stock touches or crosses its lower Bollinger Band, it is considered to be oversold, while if it touches its upper Bollinger Band, it is considered to be overbought. For example, a scan for stocks that meet the criterion *Price < Lower Bollinger Band *may turn up potential buying opportunities.
Examples of Scanz Technical Stock Screeners
With those basic indicators in mind, let’s take a look at how you can build some targeted stock screens in Scanz.
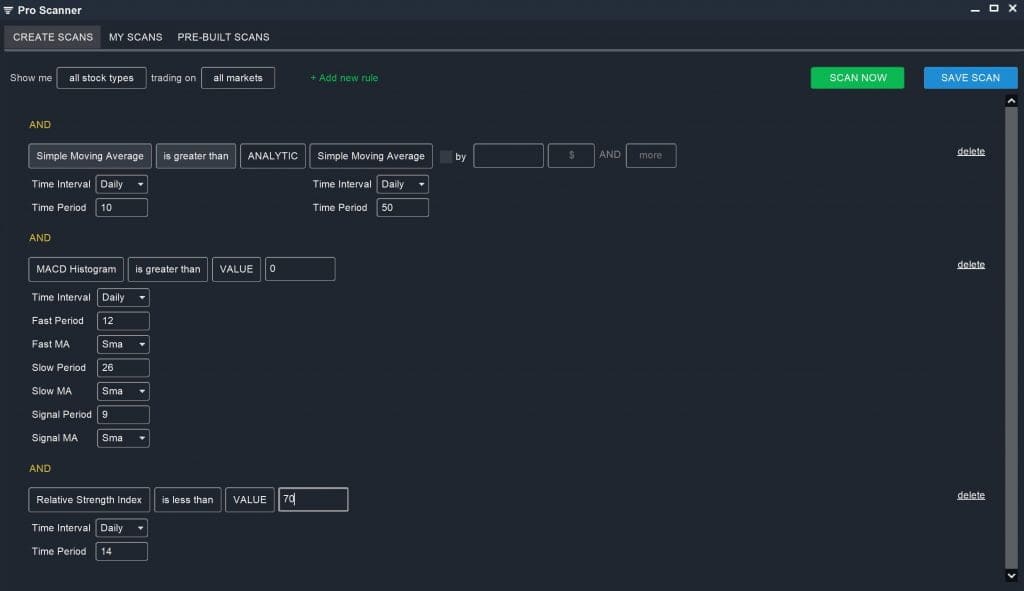
1. Bullish Momentum
The first screener you can build is one for stocks with bullish momentum. In this case, we’ll use moving averages to find stocks that are trending strongly upwards and MACD to identify stocks with momentum. We’ll also limit the RSI to less than 70 so that our screen is only turning up stocks with room to run.
Simple Moving Average (Daily, 10) is greater than ANALYTIC Simple Moving Average (Daily, 50)
AND
MACD Histogram (Daily) is greater than VALUE 0
AND
Relative Strength Index (Daily, 14) is less than VALUE 70
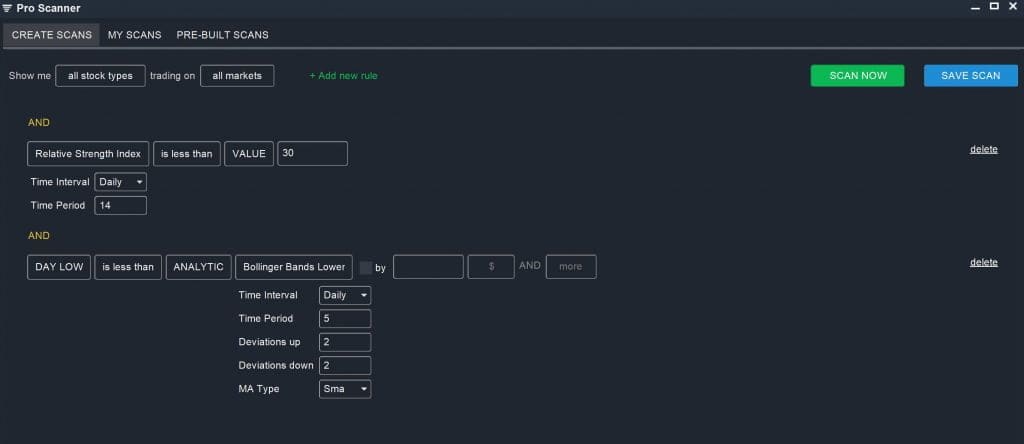
2. Oversold Stocks
Another good technical screen uses RSI and Bollinger Bands to find deeply oversold stocks. In this case, we’ll set a filter for RSI below 30 so that we’re only finding stocks that are oversold. We’ll also limit our search to stocks that have crossed their lower Bollinger Bands in the past trading day.
Relative Strength Index (Daily, 14) is less than VALUE 30
AND
DAY LOW is less than ANLAYTIC Bollinger Band Lower (Daily)
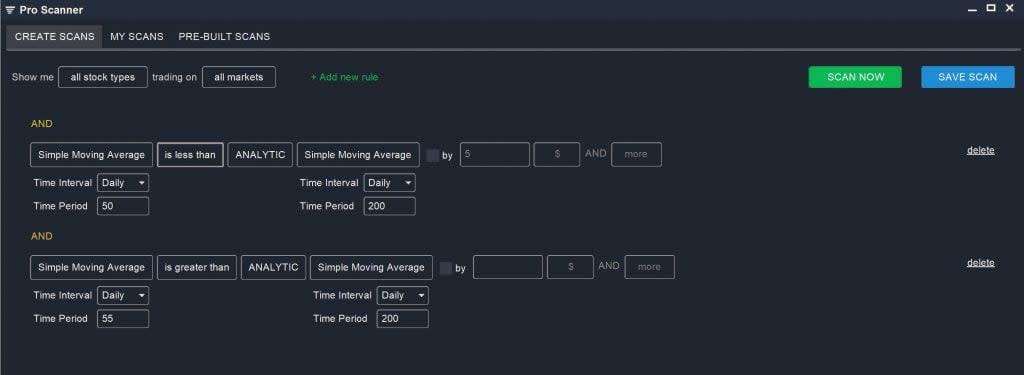
3. Death Cross
Finally, we can look for bearish signals in moving averages alone. A “Death Cross” occurs when the 50-day moving average crosses below the 200-day moving average. In this case, to ensure we’re only looking for recent crosses, we’ll add a parameter that ensures the 55-day moving average is above the 200-day moving average.
Simple Moving Average (Daily, 50) is less than ANALYTIC Simple Moving Average (Daily, 200)
AND
Simple Moving Average (Daily, 55) is greater than ANALYTIC Simple Moving Average (Daily, 200)
Conclusion
Technical stock screeners like Scanz are a powerful way to target your trading and discover new profitable setups in real time. Technical screeners are endlessly customizable, so you can build more complex and more targeted scans as you begin to work with a greater variety of technical indicators. However, as complex as you can make your screens, don’t forget about the basics – price and trading volume are important components of every technical stock screen.
Related Reading:
- How to Use a Stock Screener
- 6 Unique Filters You Can Use to Build Better Scans
- Relative Volume Scanner: The Essential Confirming Filter
- Guide to Different Types of Technical Charts
- How to Scan for Preferred Stocks
Ready to start scanning? Try for free and choose the plan that fits your workflow.