The volume-weighted average price (VWAP) is an indicator that is frequently used by day traders. By taking trading volume into account throughout the trading day, VWAP is able to inform potential buying and selling levels.
VWAP can be used on its own or as part of a broader trading strategy. In this guide, we’ll explain how you can use VWAP to improve your trading and show you how to develop a VWAP scanner using Scanz.
What is VWAP?
VWAP is essentially the total amount that was paid for a stock in a set time period divided by the number of shares traded. To calculate VWAP, multiply the price of a stock by the number of shares traded at that price. Then divide by the total number of shares traded.
If the price was constant, VWAP would just be equal to the stock price. But, as the price changes within a trading period, VWAP will fluctuate above or below the actual stock price.
In general, VWAP is calculated on all the data for a trading day. In that sense, it’s a lagging indicator that takes in more data as the trading day goes on. On a volatile day, VWAP may be very close to the stock price at 9:30 AM, but by 4:00 PM it could be quite different from the day’s closing price.
As a lagging indicator, though, VWAP should be close to the moving average that corresponds to the same amount of elapsed trading time. For example, VWAP at 11 AM, when calculated based on one-minute price intervals, should be close in value to the 90-minute moving average of the price (but not necessarily equal to it since VWAP also considers volume).
How Can You Use VWAP for Trading?
VWAP has several uses for traders.
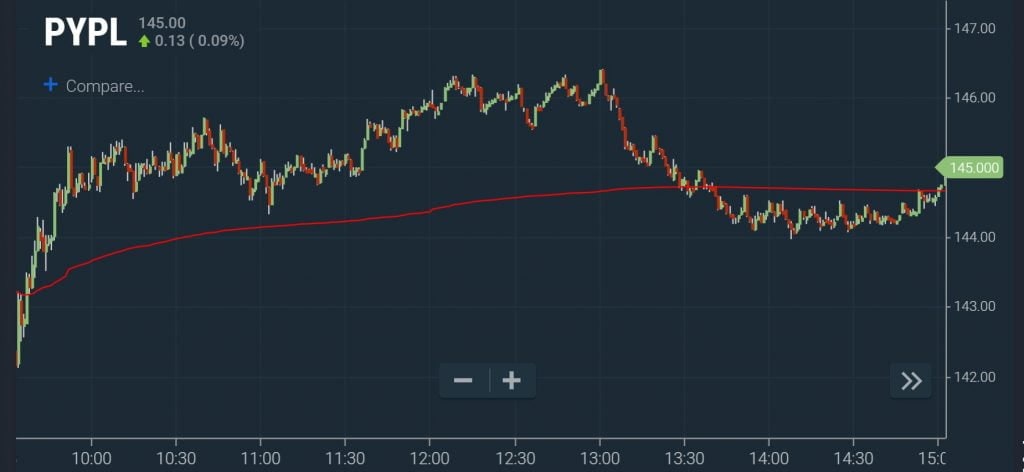
First and foremost, just like a moving average, it can provide information about which direction a stock’s price is moving in. If a stock price is trending upward over the course of a day, VWAP will also trend upwards; if the price is trending downwards, VWAP will trend downwards.
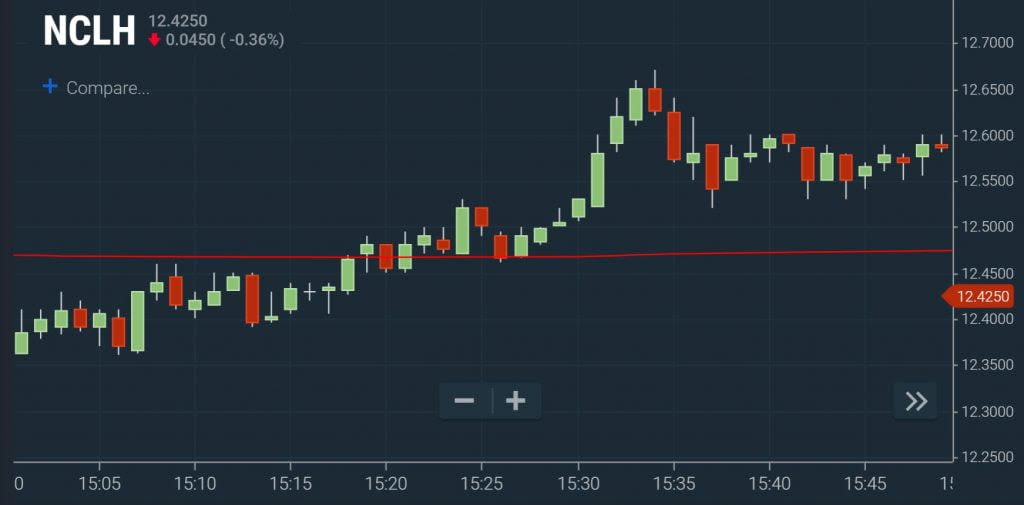
In addition, VWAP can provide information about whether a stock is overbought or oversold on an intraday timescale. When the current stock price is below VWAP, the stock is underpriced relative to the day’s trading activity. When the stock price is above VWAP, the stock is overpriced. While any strategy should use more than just VWAP to inform buying and selling decisions, simply monitoring for price-VWAP crossovers is a good way to spot potential day trading opportunities.
Another important consideration is that VWAP often serves as a support or resistance level for a stock’s price. In many cases, a stock will simply touch its VWAP briefly before continuing its prior trend. Over the course of a trading day, it can be useful to watch whether VWAP serves as a strong or weak support or resistance level. That is, does the stock repeatedly bounce off its VWAP, or does it easily cross past it? Identifying the strength of the VWAP level can be useful for trading around the indicator later in the session.
Creating a VWAP Scanner
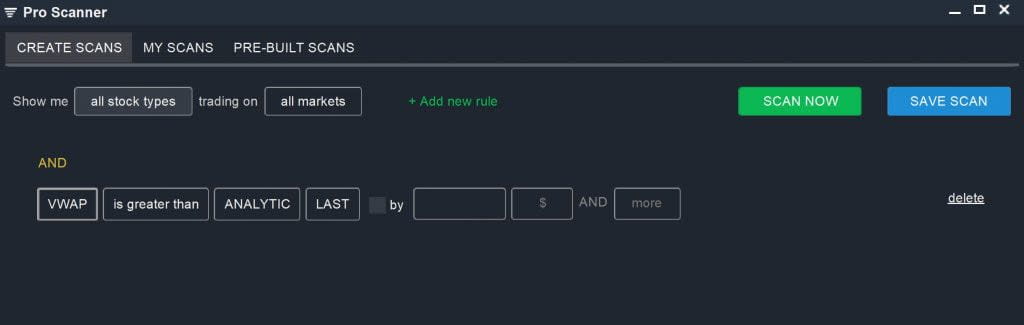
With all that in mind, let’s take a closer look at some ways you can use VWAP to build a day trading scanner in Scanz. We’ll focus on the Pro Scanner, which includes a filter for VWAP.
Overbought and Oversold Stocks
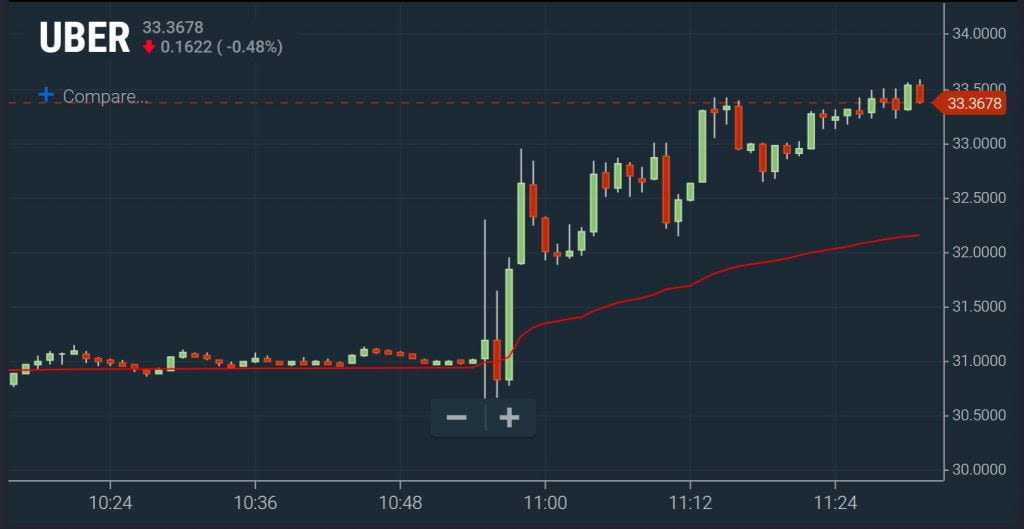
One of the best ways to use this indicator is to scan for stocks that are trading above or below their VWAP at any time. When VWAP is above the stock price, the stock is oversold; when it is below the stock price, the stock is overbought.
You can create a scan to look for bullish VWAP signals:
VWAP is greater than ANALYTIC LAST
It’s a good idea to further sort through stocks that your scan returns to look for instances where the price has just crossed below VWAP. This VWAP cross, as it’s known, is a bullish trading signal in part because day traders and institutional traders tend to use oversold conditions to purchase large volumes of shares. In turn, this pushes the stock price back up towards its VWAP and can lead to short-term profit.
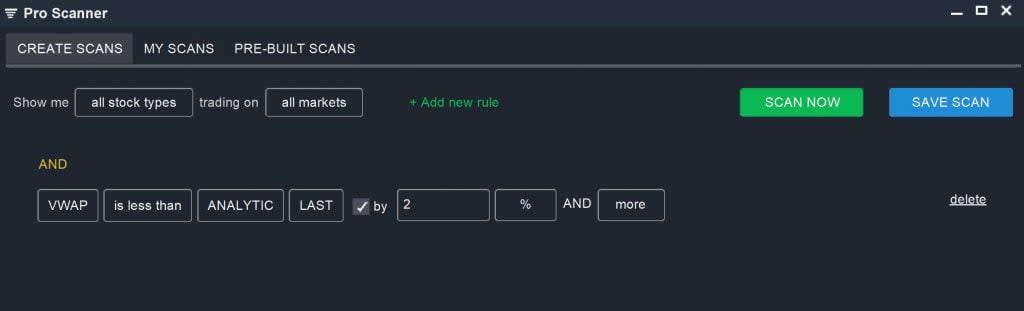
Alternatively, you can look for stocks that are trading far from their VWAP, indicating very overbought or oversold conditions. In this case, simply add ‘by 2% AND More’ to the VWAP scan parameter above. For an overbought scan, use:
VWAP is less than ANALYTIC LAST by 2% AND More
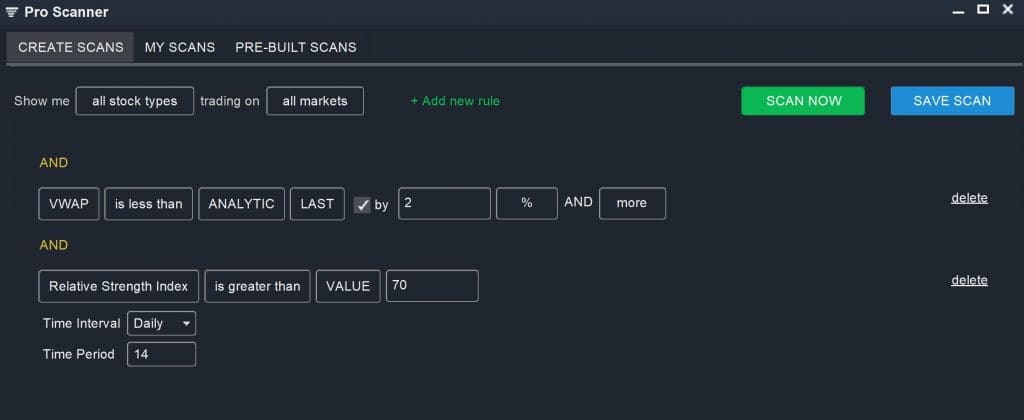
To make a VWAP scan even more powerful, you can combine it with a scan for overbought and oversold stocks based on RSI. While RSI can be applied on the same intraday timescale as VWAP, it’s a good idea to look for stocks with an RSI over 70 or below 30 on a daily chart. That way, your scan is filtering for stocks that are overbought or oversold on both intraday and daily timescales.
VWAP is less than ANALYTIC LAST by 2% AND More
AND
RSI (Daily, 14) is greater than VALUE 70
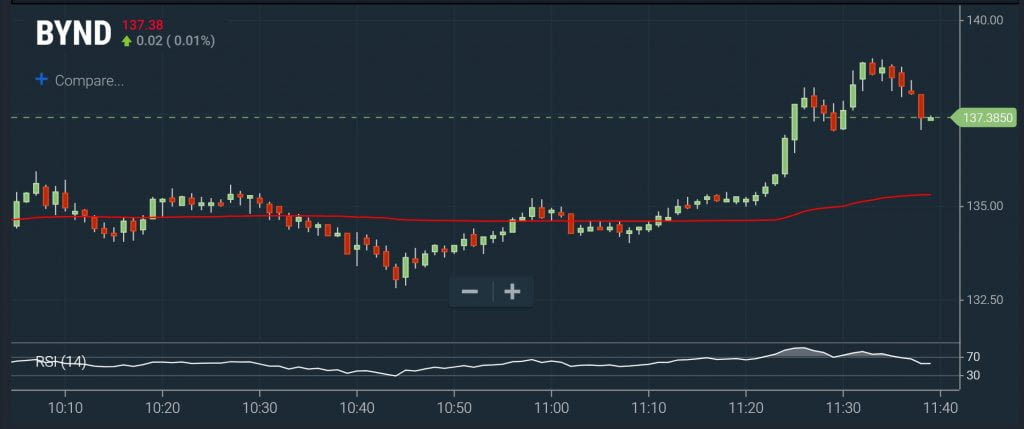
You can increase the intraday percent away from VWAP or require that the daily RSI be greater than 80 to limit your scan to more extreme overbought conditions.
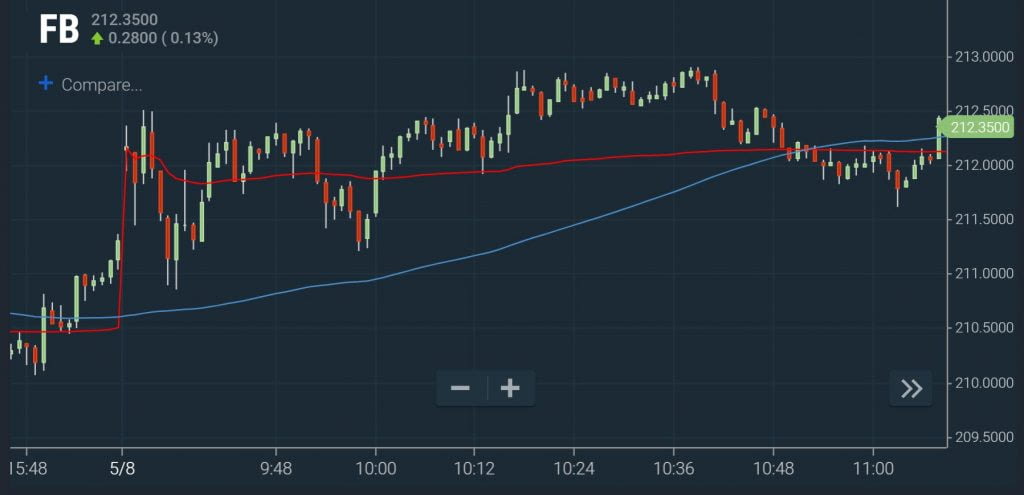
VWAP and Moving Averages
Another way to create a stock scanner using VWAP is to compare the indicator against moving averages that only account for price. These standard moving averages are valuable because they smooth out the choppiness of intraday price data. Using moving averages can help eliminate false VWAP signals.
In this case, you can also specifically target VWAP crossovers by using moving averages of two different lengths. For example:
Simple Moving Average (5m, 10) is greater than ANALYTIC VWAP
AND
Simple Moving Average (5m, 5) is less than ANALYTIC VWAP
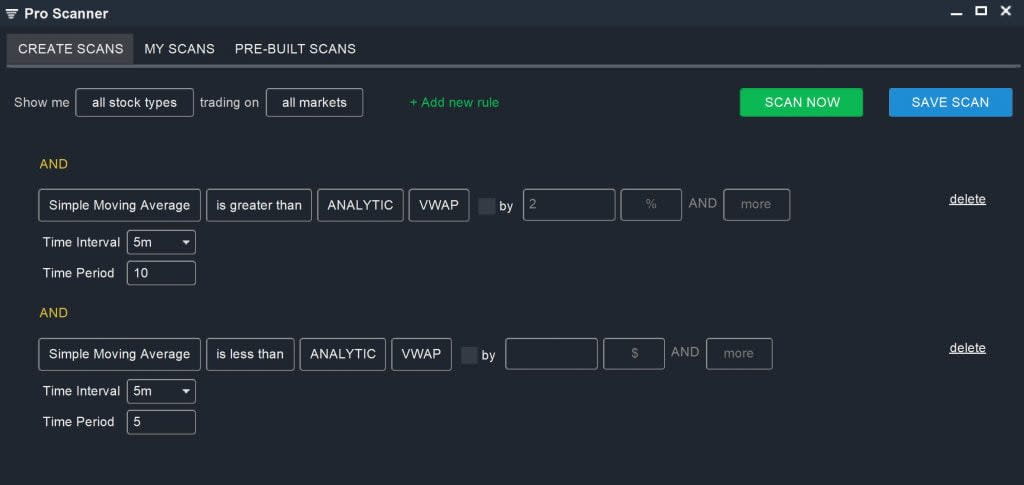
This scan specifically filters for stocks for which the VWAP is in between two short-term moving averages, indicating a price crossover within the last few minutes. These stocks can then be monitored to see if the price and VWAP continue to diverge, potentially presenting a trading opportunity.
Conclusion
VWAP is a key indicator that is widely used by day traders to spot short-term overbought and oversold conditions. By tracking VWAP throughout the day, you can keep an eye on whether a stock is trading at a premium or a discount relative to what other traders have been buying and selling it at on a per-minute basis. Furthermore, you can use the Pro Scanner in Scanz to create a simple VWAP scanner to home in on potential intraday buying opportunities.
Related Reading:
- 4 Great Intraday Scans for Day Traders
- RSI Stock Screeners: Combining Intraday Signals
- How to Find Stocks to Day Trade
Ready to start scanning? Try for free and choose the plan that fits your workflow.