Wedge patterns are chart patterns similar to symmetrical triangle patterns in that they feature trading that initially takes place over a wide price range and then narrows in range as trading continues. However, unlike symmetrical triangles, wedge patterns are reversal signals and have a strong bias towards being either bullish – for falling wedges – or bearish – for rising wedges. Wedge patterns can be difficult to recognize and trade effectively since they often look much like background trading activity on charts.****
Wedge Patterns
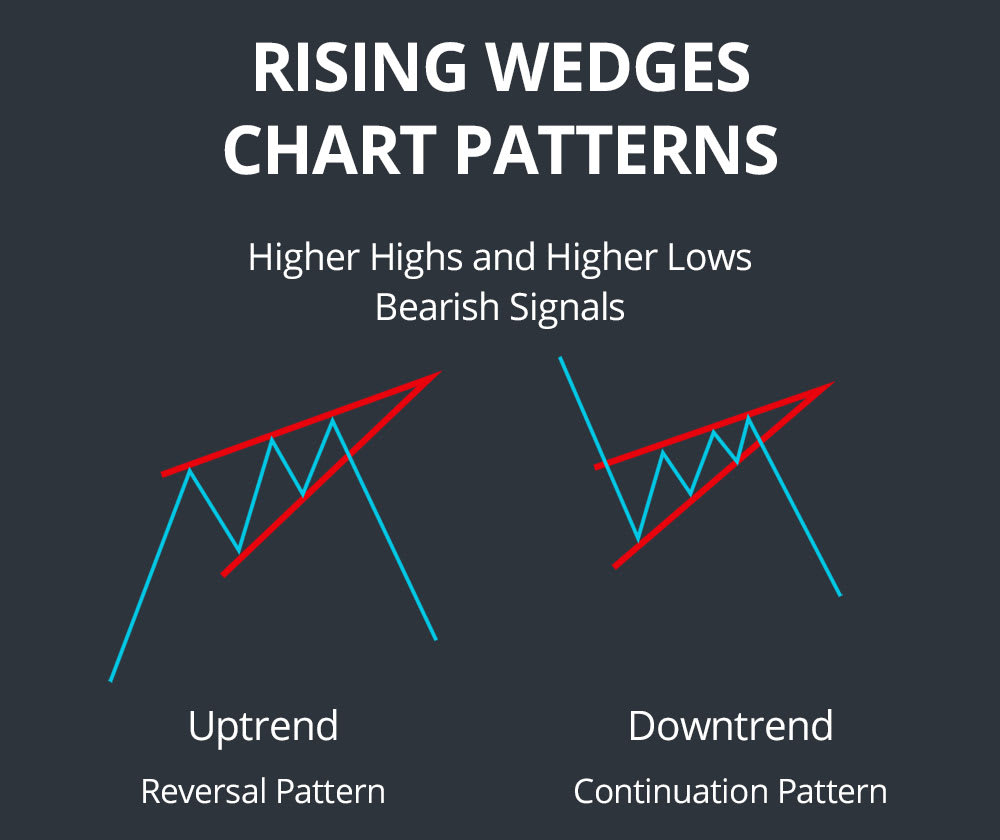
Rising Wedges
Rising wedges are bearish signals that develop when a trading range narrows over time but features a definitive slope upward. This means that in contrast to ascending triangles, both subsequent lows and subsequent highs within the wedge pattern will be rising as the trading range narrows towards the apex of the wedge.
As bearish signals, rising wedges typically form at the end of a strong bullish trend and indicate a coming reversal. However, rising wedges can occasionally form in the middle of a strong bearish trend, in which case they are running counter to the main price movement. In this case, the bearish movement at the end of the rising wedge is a continuation of the main downward trend.
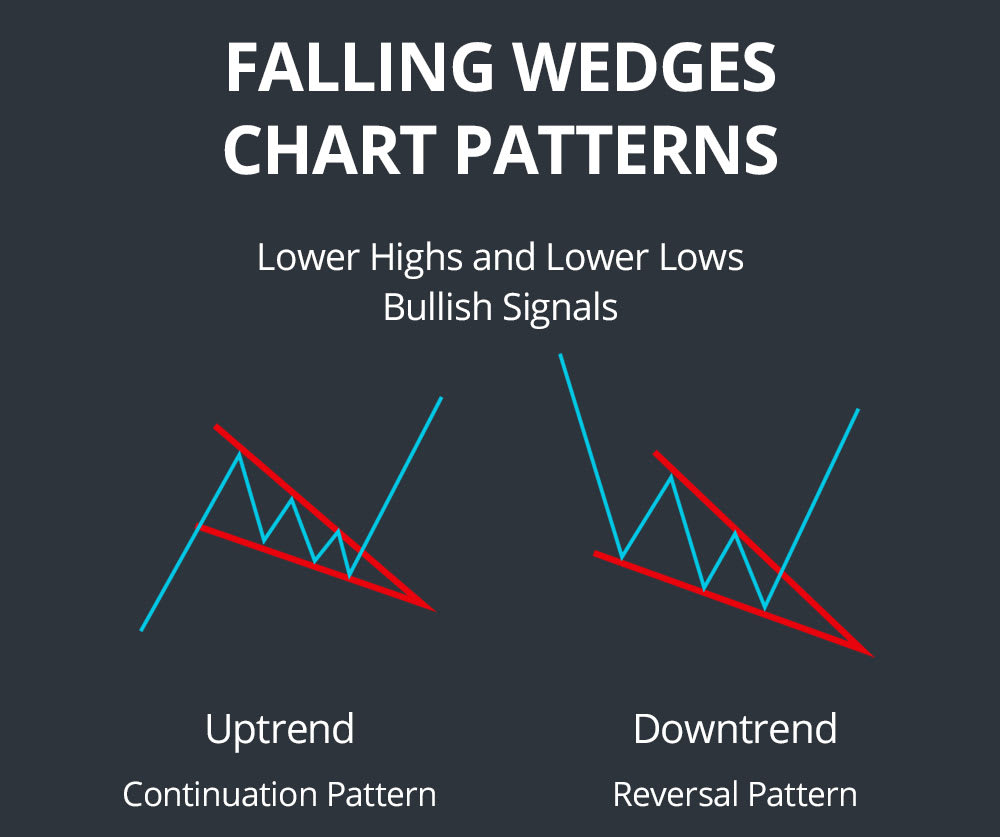
Falling Wedges
Falling wedges are the inverse of rising wedges and are always considered bullish signals. They develop when a narrowing trading range has a downward slope, such that subsequent lows and subsequent highs within the wedge are falling as trading progresses.
Falling wedges are typically reversal signals that occur at the end of a strong downtrend. However, they can occur in the middle of a strong upward movement, in which case the bullish movement at the end of the wedge is a continuation of the overall bullish trend.
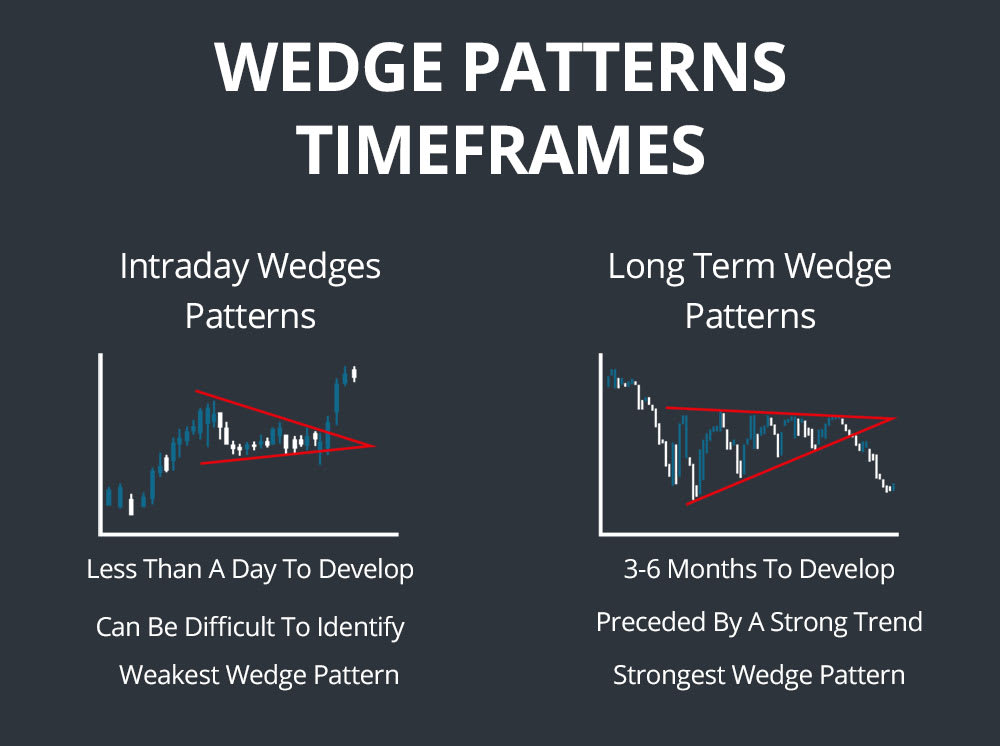
Timeframes
Both rising and falling wedges can occur over both intraday and months-long timeframes, although intraday wedges can be difficult to identify with much certainty. The strongest wedge patterns develop over a three- to six-month period and are preceded by a strong trend that is at least several months long. However, it is also possible that the trend is contained partially or entirely within the wedge pattern itself. The reversal signaled by the wedge may be either an intermediate reversal within the larger trend or a long-term reversal.
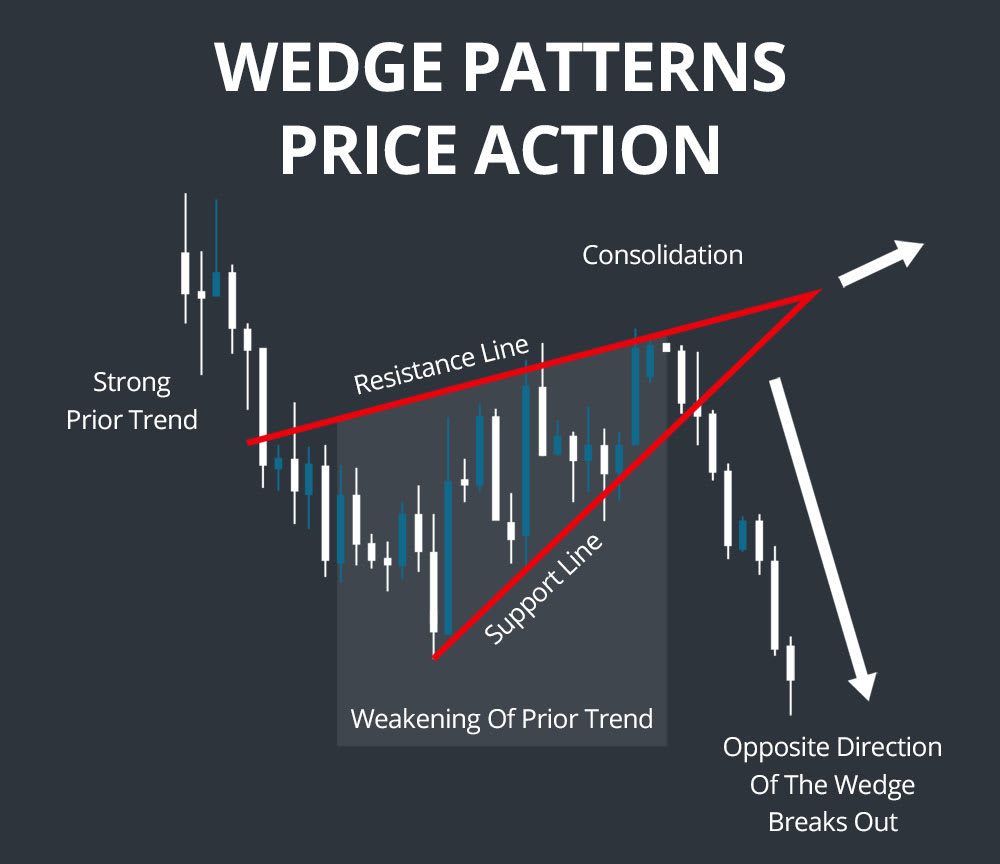
Wedge Patterns Simplified
Wedge patterns are typically a result of consolidation following a strong trend, but in contrast to triangle patterns they indicate a weakening of the prior trend rather than a strengthening. Rising wedge patterns form when the support line is rising faster than the resistance line, while falling wedge patterns form when the support line is falling faster than the resistance line. When a wedge breaks out, it is typically in the opposite direction of the wedge – marking a reversal of the prior trend.
How to Trade Wedges
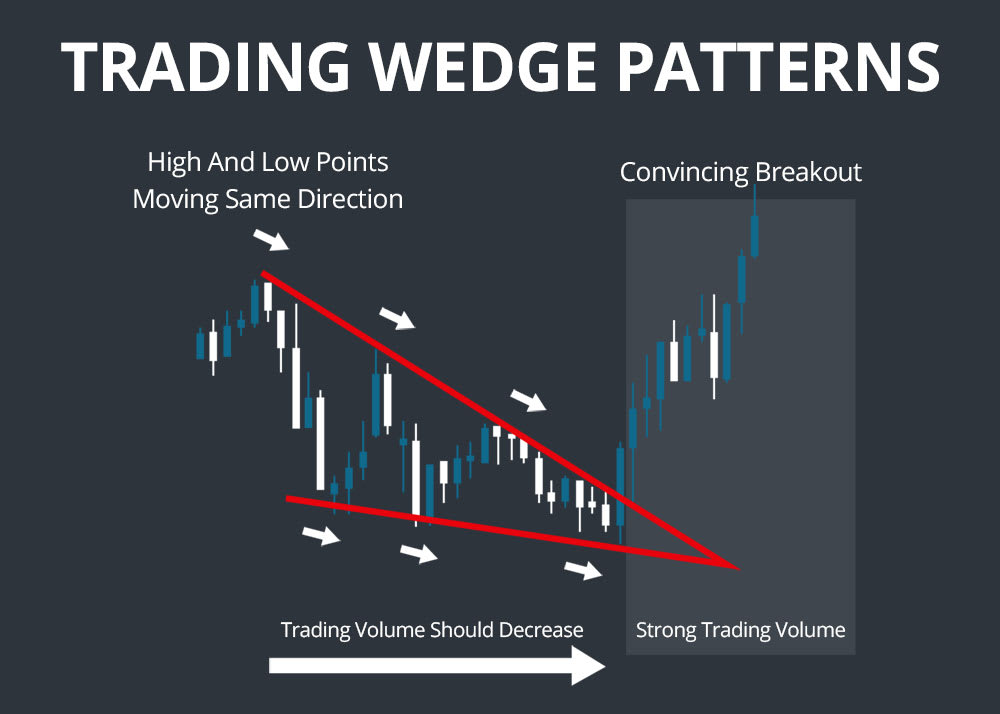
Wedges can be tricky to identify since the trend preceding the formation of the wedge can be encompassed partially or entirely within the wedge itself. As the trading price range narrows as the wedge progresses, trading volume should decrease.
Importantly, in contrast to triangle patterns, both the high and low points that form the wedge should be moving in the same direction – either up or down – as the trading range narrows. For a rising wedge, this means that both the lows and highs are increasing as the wedge progresses, while for a falling wedge both the highs and lows are decreasing as the wedge progresses. In rising wedges where the highs rise only a little, or in falling wedges where the lows fall only a little, it can be very difficult to tell a wedge apart from an ascending or descending triangle that signals an opposite price movement upon breakout.
The breakout – bullish in a falling wedge and bearish in a rising wedge – should be convincing and come on strong trading volume before trading on it. It is often prudent to wait until the breakout surpasses a prior support or resistance line before trading.
Unlike for triangle patterns, there is no reliable method for estimating a price target on the extent of the movement following the breakout based on the shape of the wedge. Therefore, trailing stop losses are extremely important and other charting indicators should be used to estimate the extent of the movement.
Examples
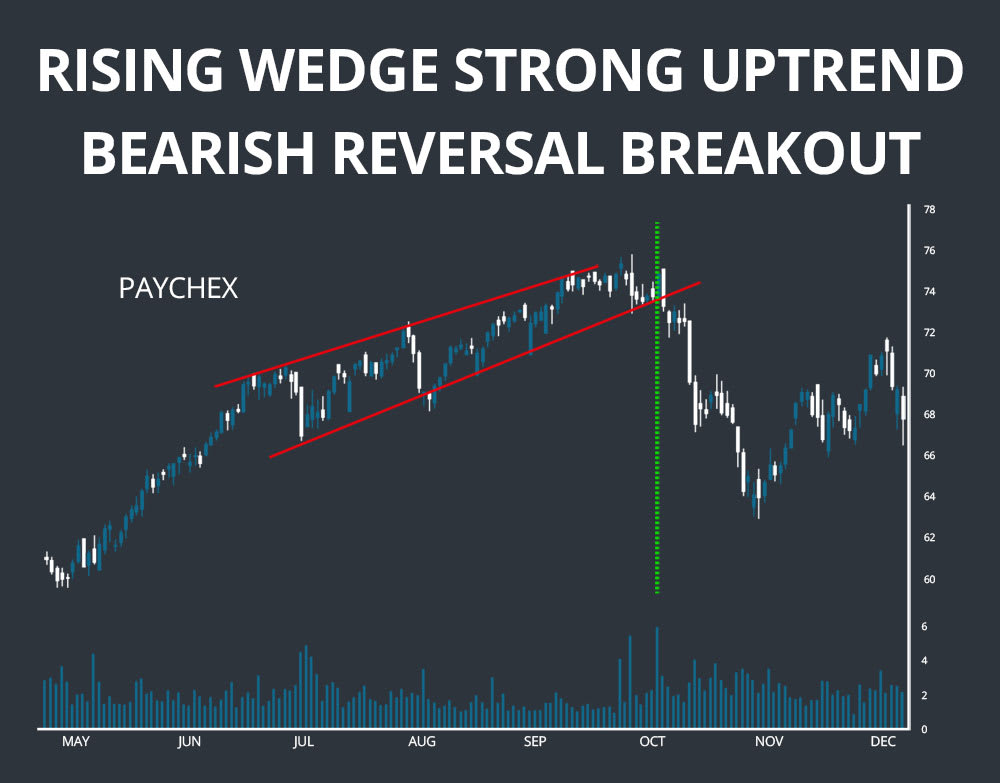
The first example shows a rising wedge that follows a strong uptrend and develops over an approximately three-month period. Note that there are numerous tests of the lower support line, some of which could be interpreted as false breakouts if there is no effort made to confirm the breakout with trading volume or other indicators. The true breakout is a bearish reversal, as expected for rising wedges, and comes on high trading volume.
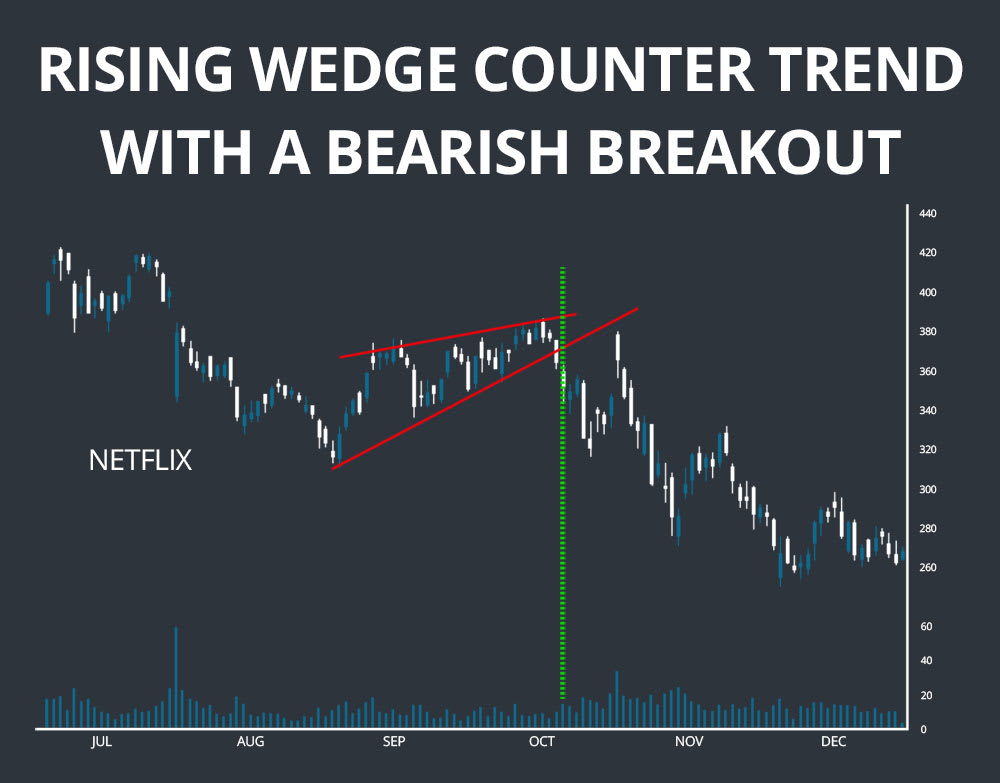
The second example also shows a rising wedge, although in this case the wedge runs counter to the main trend and the bearish breakout represents a continuation of the main downward trend. The area of the wedge breakout then serves as a resistance line on a subsequent rally. Note that the volume on the bearish breakout is relatively low in this continuation move, although it is still higher than the trading volume in the days prior to the breakout.
Conclusion
Wedge patterns are typically reversal patterns that can be either bearish – a rising wedge – or bullish – a falling wedge. These patterns can be extremely difficult to recognize and interpret on a chart since they bear much resemblance to triangle patterns and do not always form cleanly. Therefore, it is important to be careful when trading wedge patterns and to use trading volume as a means of confirming a suspected breakout.
Related Reading:
- A Comprehensive Guide to Triangle Patterns
- A Comprehensive Guide to Cup and Handle Patterns
- How to Find Breakout Stocks
Ready to start scanning? Try for free and choose the plan that fits your workflow.