While the majority of traders are looking for bullish opportunities, you can also profit off of downturns in a stock or the broader market by shorting. While shorting is risky, it can pay off since there generally aren’t that many traders looking for short opportunities. Plus, shorting some stocks can help you hedge your bets against other bullish bets.
In this guide, we’ll take a look at three ways you can spot short opportunities using the technical screens in Scanz.
What is Shorting?
When you short a stock, you’re essentially betting that the price will go down. Instead of buying shares, you borrow them from another trader through your brokerage and sell them at the current price. You’ll eventually need to buy those shares back to give them back to the original owner, so you benefit if the price drops from what you sold the shares at. If the price goes up, though, you’re still on the hook to buy the shares back and you’ll take a loss on the trade.
Should You Short a Stock?
Shorting is inherently riskier than buying stocks. When you buy a stock, the most money you could lose is the amount you invested. But when you short, there’s no limit on how high the price can rise – and therefore, how much you’d have to pay to return the borrowed shares. Shorting stocks also comes with additional complications like worrying about margin calls from your broker.
So, shorting stocks isn’t for everyone. But, for traders who are willing to accept more risk for potentially greater returns, shorting allows you to profit when the market is going down rather than only when it’s going up. It also allows you to target companies whose stock prices are overinflated relative to what fundamental or technical conditions warrant.
3 Ways to Scan for Short Opportunities
With those considerations in mind, let’s take a look at several ways you can use the Pro Scanner in Scanz to find potentially profitable short trades.
1. Death Cross and RSI
One of the best ways to find a potential stock to short is to look for bearish momentum. While there are many ways to go about this, one of the easiest patterns to spot and analyze is the so-called “Death Cross.” This occurs when the 50-day moving average crosses below the 200-day moving average. Combined with a low RSI to indicate increasing downward momentum, this is a powerful strategy for picking bearish stocks. This scan will help you find stocks that have been moving to the downside for a while and haven’t shown any signs of a recovery. You can set up this scan with these parameters:
Simple Moving Average (Daily, 50) is less than ANALYTIC Simple Moving Average (Daily, 200)
AND
Simple Moving Average (Daily, 60) is greater than ANALYTIC Simple Moving Average (Daily, 200)
AND
Relative Strength Index (Daily, 14) is less than VALUE 50
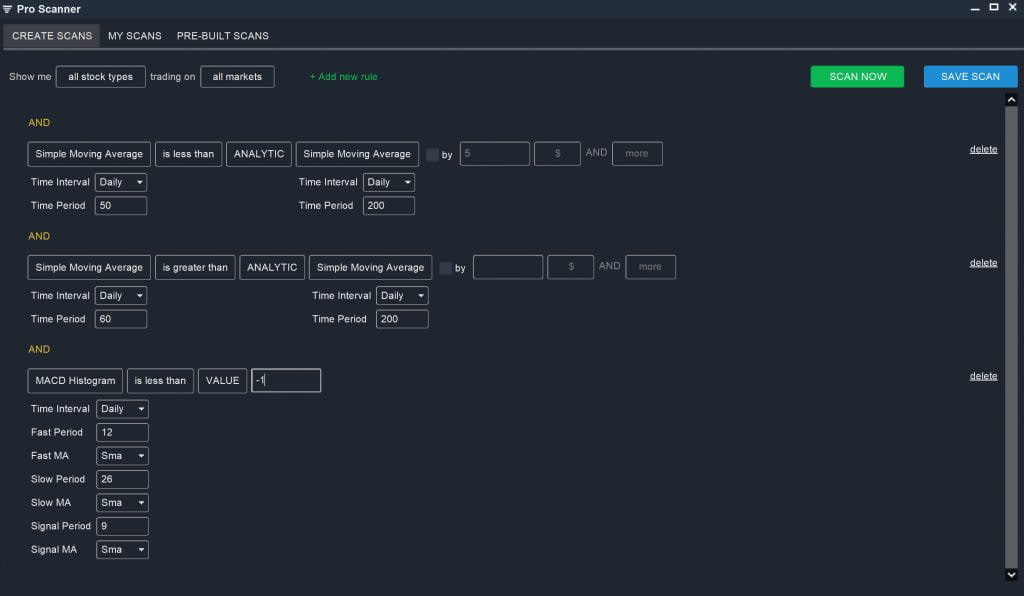
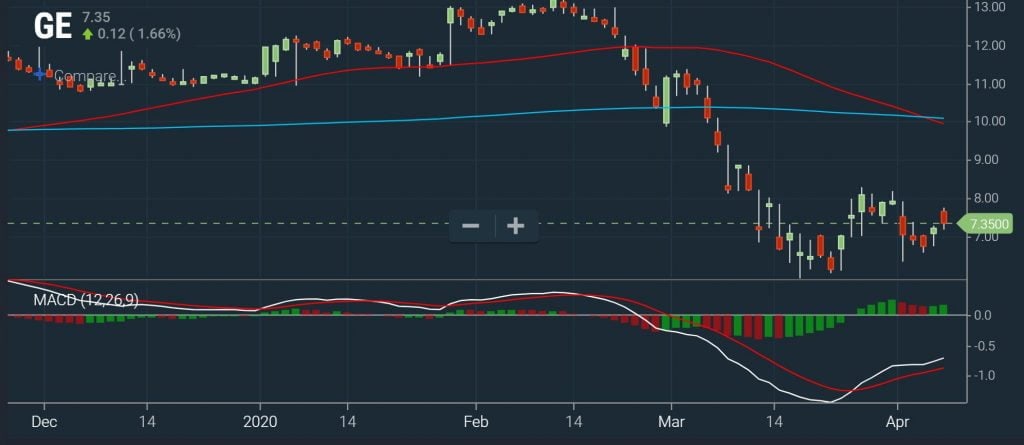
Note that the 60-day moving average parameter helps to ensure the scan will only identify recent death cross patterns.
2. Strong Resistance or Breaking Below Support
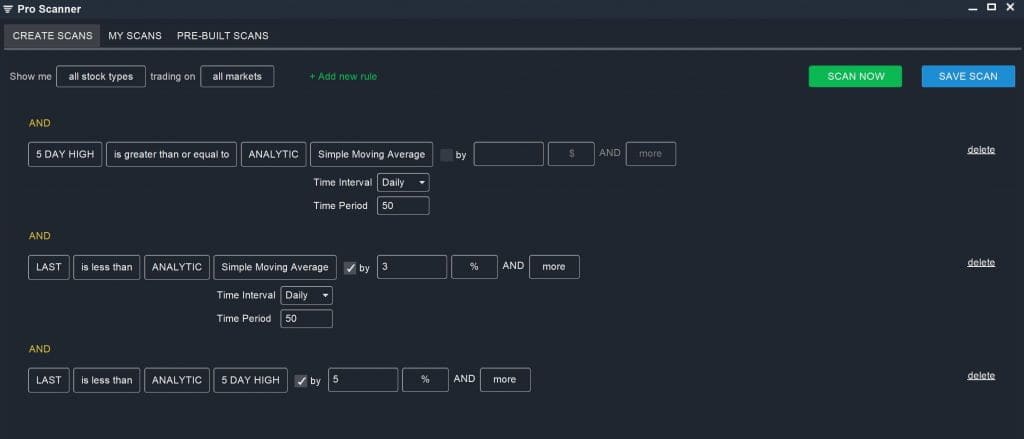
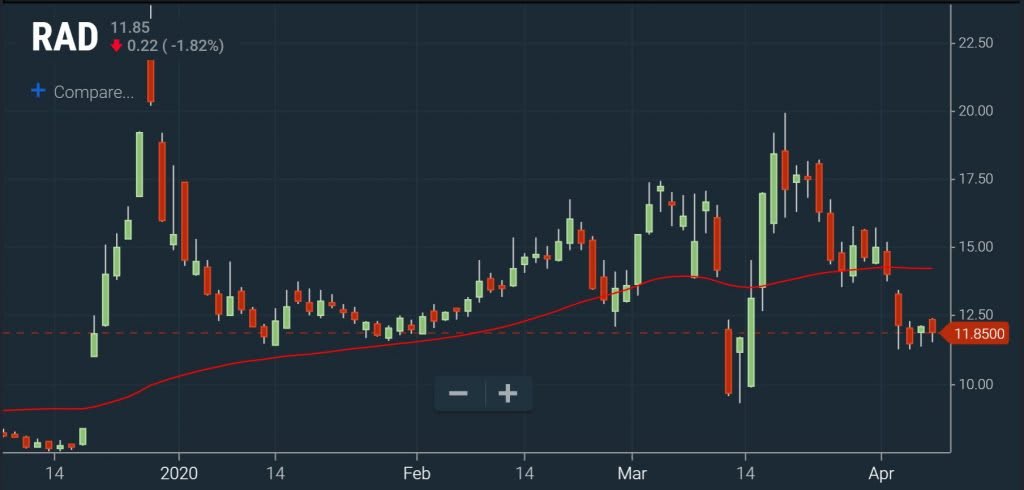
Another potential trigger for shorting a stock is if it comes up against strong resistance when trying to break above a moving average or if it falls strongly below a support level. Figuring out whether support or resistance will hold typically requires a combination of technical studies, gauging market sentiment, and looking at past tests of that support/resistance band. But, you can find potential resistance reversal candidates by screening for stocks that are hitting a moving average but not breaking above it. You can find potential bearish support breaks by looking for stocks that fall well below a moving average.
In either case, the initial scan is relatively similar. We’ll create a screener that looks for stocks that met or exceeded their 50-day moving average before crossing bearishly below it. You’ll want to be careful to analyze volume when considering these potential reversals, since any true bearish move should have traders’ support behind it. You can include a volume filter in your screen, although beware that this might not turn up potential setups that haven’t completed with a high-volume bearish move yet.
5 DAY HIGH is greater than or equal to ANALYTIC Simple Moving Average (Daily, 50)
AND
LAST is less than ANALYTIC Simple Moving Average (Daily, 50) by 3% AND More
AND
LAST is less than ANALYTIC 5 DAY HIGH by 5% AND More
3. Strongly Overbought Conditions
One additional way to find stocks to short is to look for strongly overbought conditions. Overbought conditions usually result after a period of sustained momentum. For short selling, you need to find the moment when a stock’s bullish steam is running out and the high prices can no longer be supported.
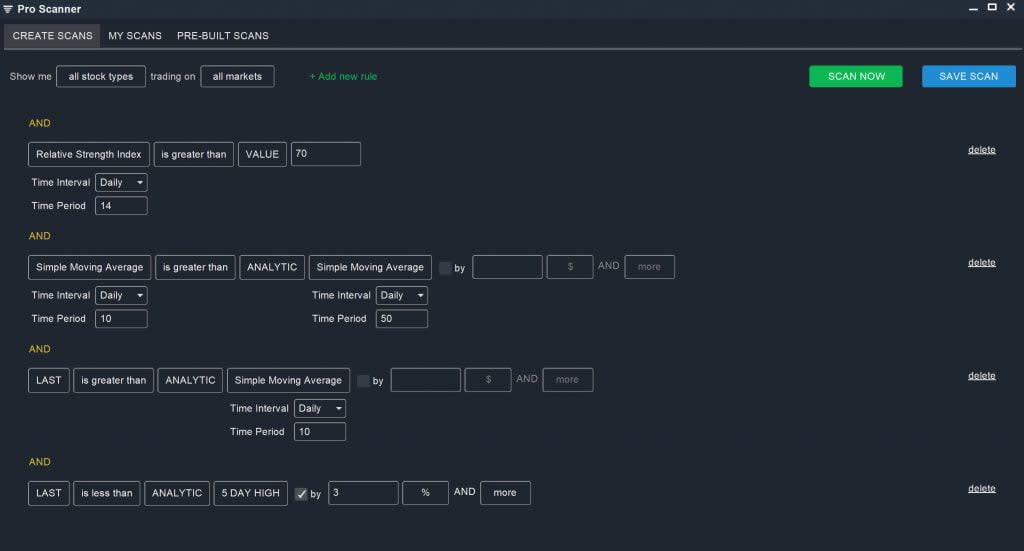
To scan for that, you first need to find stocks that have been moving upward. You can use RSI and moving averages for that. Then, your scan should look for a stumble. There are a couple ways to go about that, but a simple one is to look for stocks that can’t breach highs set a few days prior. In this case, the scan looks like:
Relative Strength Index is greater than VALUE 70
AND
Simple Moving Average (Daily, 10) is greater than ANALYTIC Simple Moving Average (Daily, 50)
AND
LAST is greater than ANALYTIC Simple Moving Average (Daily, 10)
AND
LAST is less than ANALYTIC 5 DAY HIGH by 3% AND More
Conclusion
Shorting stocks can be risky, but going against the grain of most other traders can be very profitable as well. By developing technical screeners to identify stocks that are poised for a price drop, you can identify potential short opportunities that the majority of traders simply aren’t looking for. Keep in mind that the three scan strategies that we presented are just a starting point – you can use Scanz to build on and modify these, or to create your own bearish scans from scratch.