Most day traders’ workdays start well before the morning bell rings. Stocks showing strong activity in the hours leading up to market open can be ripe targets for profitable day trades, especially if you know what to look for.
With the Scanz Pro Scanner, it’s easy to find premarket movers that could be setting up for a big move. Let’s take a look at four premarket scans you can use to set yourself up for success each morning.
Gappers with Volume
A lot of premarket scans revolve around looking for gappers – stocks that are trading above the previous day’s close after a bullish day or below the close after a bearish day. Gap-up and gap-down stocks may revert to the previous days’ close, but they may also experience a big price movement before doing so.
Gaps alone are not enough to trade on, though. They need to be supported by above-average premarket trading volume. This indicates that the gap is strong enough that it won’t be closed as soon as the market opens.
You can find gap-up stocks trading on solid volume using these three parameters:
PREV DAY CLOSE is greater than ANALYTIC PREV DAY OPEN
AND
LAST is greater than ANALYTIC PREV DAY CLOSE
AND
DAY’S TRADES is greater than or equal to VALUE 2,000

You may want to consider a few customizations to this scan as well. Adding a “by” parameter allows you to look only at stocks that are gapping up by 5% or more, for example. You can also change the volume parameter to filter by dollar-volume, which normalizes for stock price, as opposed to the number of trades placed. In the Pro Scanner results, it’s a good idea to sort by volume rather than price change to make sure you’re focusing in on gappers with the most support in premarket trading.

Gappers Breaking Resistance
If premarket trading is able to break through a resistance area on good volume, it’s very likely that the stock is poised to take off as soon as the market opens. When scanning for resistance areas, common moving averages like the 10-day or 50-day simple moving averages are good places to start. You can look for stocks that have broken above these during premarket hours using this scan:
LAST is greater than ANALYTIC Simple Moving Average (Daily, 50)
AND
PREV DAY CLOSE is less than ANALYTIC Simple Moving Average (Daily, 50)
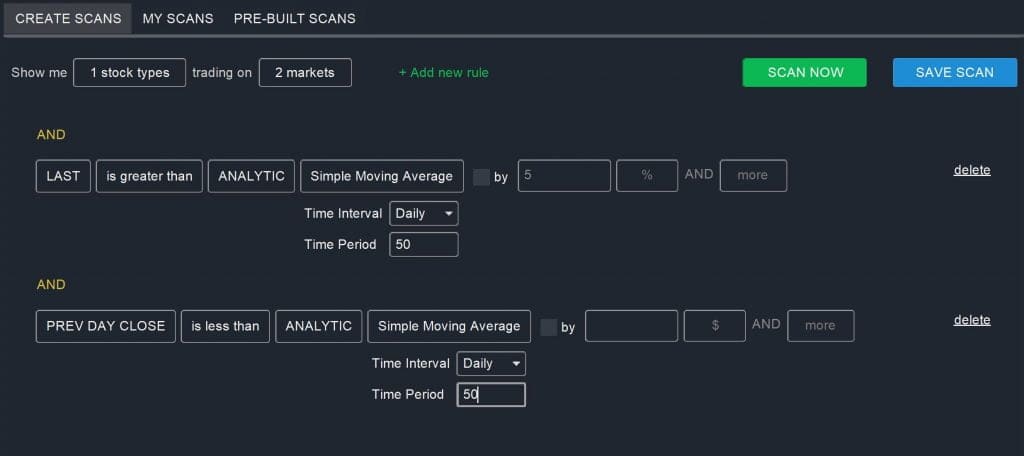
It’s a very good idea to add a volume filter similar to the one described above into this scan. That way, you can be more confident that the resistance line was broken with some support behind the movement and that the resistance line break will be sustained after market open. Along the same lines, it’s important to monitor these stocks as market open approaches – if they fall back below the resistance line, they may be setting up for a reversal.

Premarket Reversal
Premarket trading activity can also be used to identify potential reversals. The best way to spot these is to look for stocks that move up to a resistance band, such as a moving average, and then pullback from that resistance band before market open. If this activity happens on decent volume, it may indicate that the stock will bounce off of the resistance band again during normal market hours.
You can spot stocks exhibiting a premarket reversal with these filters:
PREV DAY CLOSE is greater than ANALYTIC PREV DAY OPEN
AND
LAST is greater than or equal to ANALYTIC PREV DAY CLOSE
AND
DAY HIGH is greater than or equal to ANALYTIC Simple Moving Average (Daily, 50)
AND
LAST is less than ANALYTIC Simple Moving Average (Daily, 50)
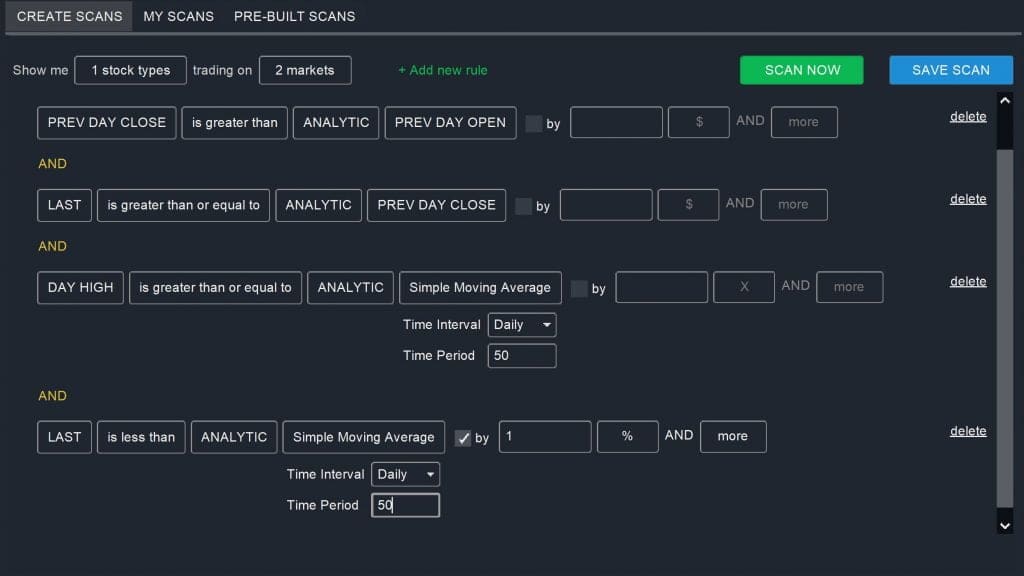
Again, including an additional volume filter in this scan is a good way to ensure you’re only looking at stocks that have experienced a relatively high degree of premarket activity. You’ll also want to carefully examine the charts of any prospective reversals identified in premarket trading to see if there are other indicators of a pending reversal.
Bullish MACD and RSI
MACD and RSI are two indicators commonly used by day, swing, and momentum traders to spot bullish stocks. When combined with a scan for premarket gappers with volume, MACD and RSI can help you identify stocks that are setting up for potentially bigger gains throughout the trading day.
PREV DAY CLOSE is greater than ANALYTIC PREV DAY OPEN
AND
LAST is greater than ANALYTIC PREV DAY CLOSE
AND
DAY’S TRADES is greater than or equal to VALUE 2,000
AND
Relative Strength Index (Daily, 14) is greater than or equal to VALUE 55
AND
MACD Histogram is greater than VALUE 0

You can revise the RSI or MACD histogram values to scan for stocks that have already been trending upwards in previous days. Make sure you use a daily timescale for these indicators, as premarket trading is unlikely to yield reliable MACD and RSI values.

Conclusion
Monitoring premarket trading activity can give you a significant edge when the morning bell rings. With these four scans, you can use Scanz to identify stocks that are poised for a big move and open a position before it happens. Keep in mind, though, that premarket trading volume is often light. It’s extremely important to look only at stocks trading with above-average premarket volume when scanning for potential trades.