The platform made for
finding trades The platform made for finding trades
Purpose-built for highly active stock traders.
Day traders. Swing traders. Scanz is purpose-built for the most highly active stock traders.
Get every weapon you need to identify & monitor your A+ trade setups in real-time.
Scanners · Signals · Alerts · News · Watchlists · Charts
The world's most active traders depend on Scanz each day
"I've been using Scanz for most of my trading career. I cannot overstate how happy I've been with their versatile scanning software and quick news alerts. I cannot imagine my day to day trading without it."

Tim Grittani
Legendary retail trader
Supercharge your trading workflow
End-to-end. Scanz gives you the most optimized and efficient path from trade idea to trade execution. Discover what it feels like to be in full control of your trading.
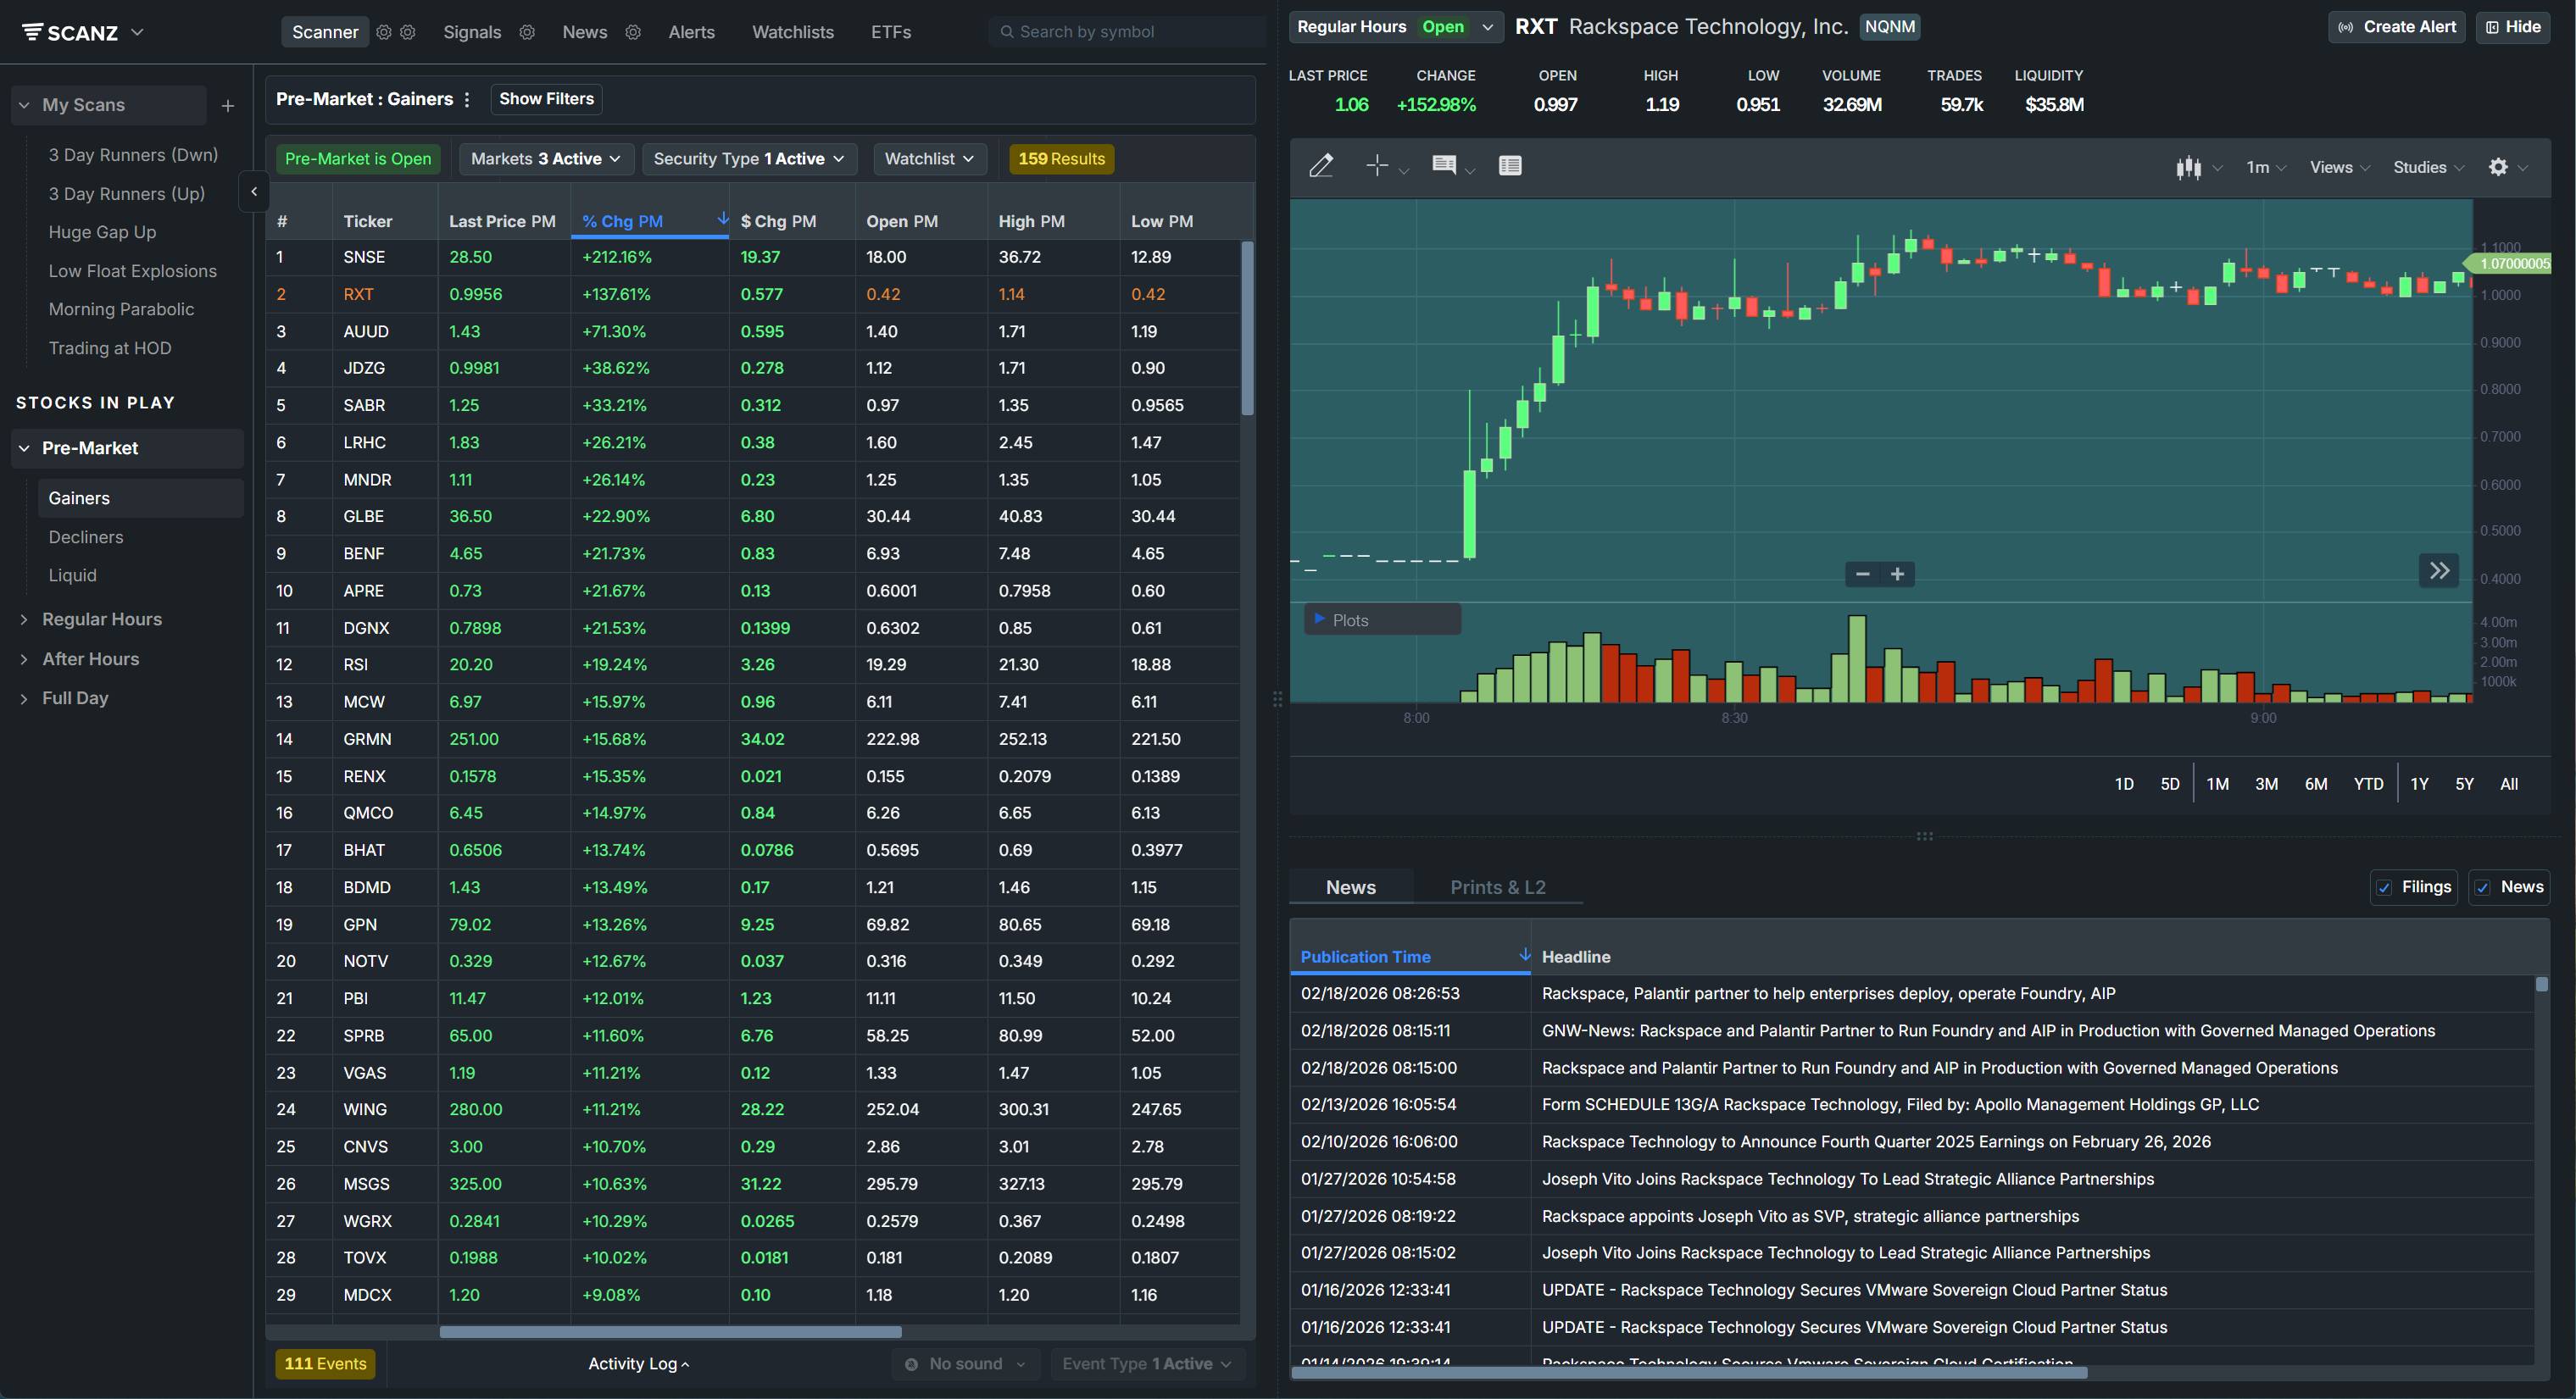
Scanners to find the trades
Real-time scanners surface opportunities the moment they meet your strategy criteria.
Tools to analyze the trades
Drill down on the candidates with charts and Level 2 for full transparency.

Integrations to make the trades
Execute within Scanz using our super-fast trading interface and your broker of choice.
Scanners to find the trades
Real-time scanners surface opportunities the
moment they meet your strategy criteria.
Tools to analyze the trades
Drill down on the candidates with charts
and Level 2 for full transparency.
Integrations to make the trades
Execute within Scanz using our super-fast
trading interface and your broker of choice.
Trade discovery. Simplified
Finding trades in real-time is the lifeblood of your strategy.
Effortlessly build and run your trade ideas in seconds with Scanz's powerful scanning tools.
Scanners
Real-time stock lists that feed you trade opportunities as they happen
Filters
Refine your real-time lists down to what's most relevant to you.
Data columns
Insanely powerful customizable columns on each scan.
Market Sessions
Pre-mkt, Regular, After hrs, and consolidated. Unmatched.
Time frames
Go down to as low as 1-minute across the entire platform.
Helping experienced traders sharpen their edge and new traders find theirs
"An essential part of my trading toolkit. I have the platform pulled up every single day. If you're looking for a powerful scanning platform, I highly recommend Scanz."

Nathan Michaud
Founder of the #1 trading community
Monitor the opportunities
Much more than a scanning platform.
Scanz delivers full decision support to pull the trade trigger with confidence.
Watchlists
Create and manage stock lists. Your watch lists stay with you across all devices.
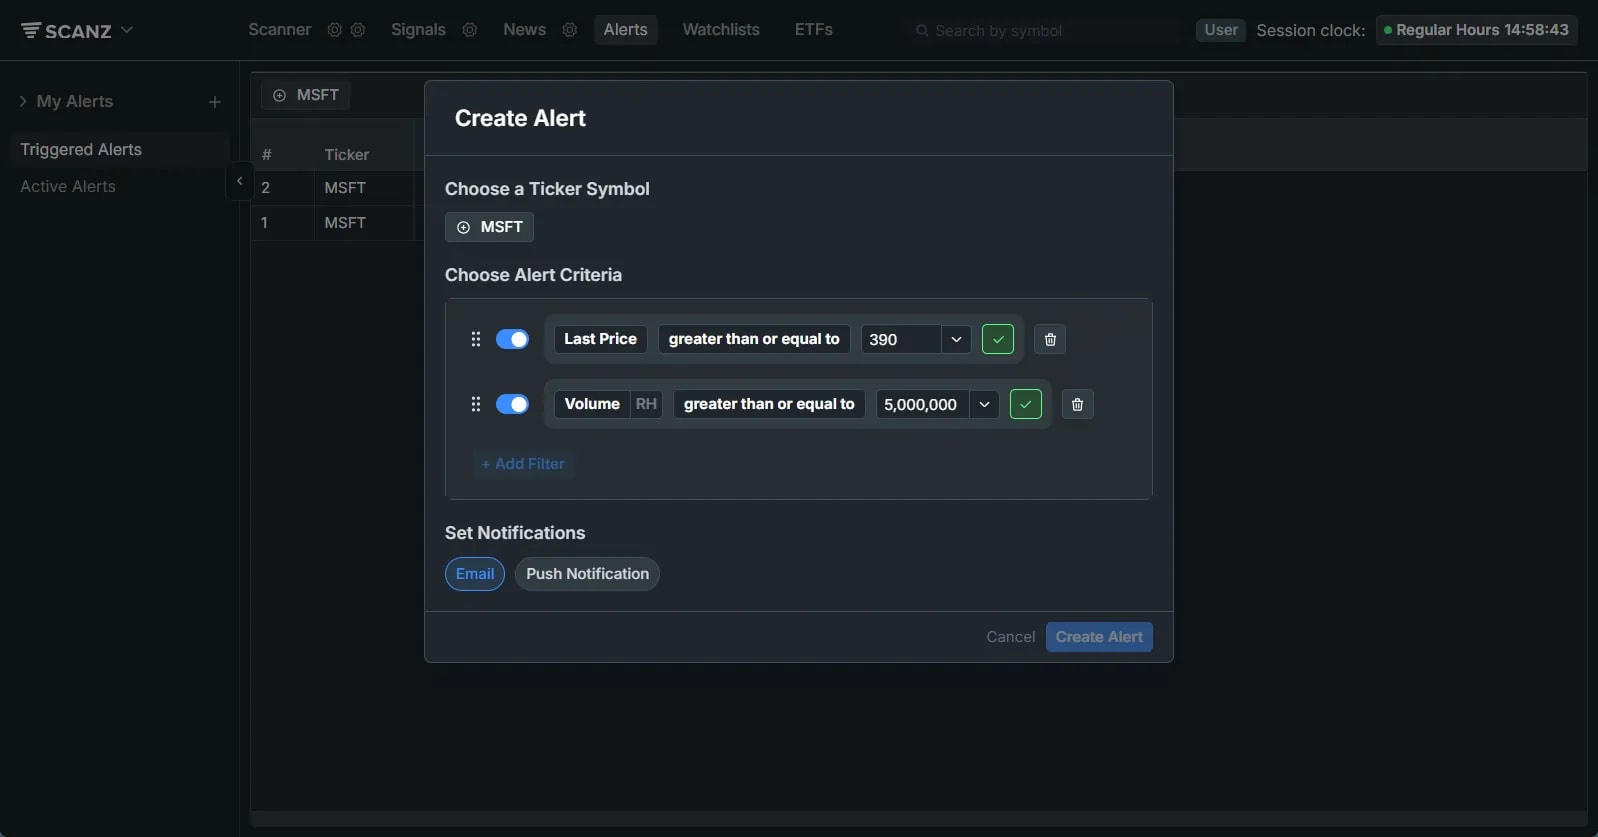
Make the trade
Execute trades with precision and speed.
Connect your broker, sync your account, and trade without ever leaving Scanz. Our super-fast trading interface was crafted for active trading.


Hotkeys for speed
Execute orders in milliseconds with pre-configured keyboard shortcuts.
Keyboard-first design
Navigate the entire trading interface without ever touching a mouse.
All-in-one window
Scanner, chart, Level 2, and order entry in a single unified workspace.
Built-in risk controls
Set daily loss limits and max position sizes to protect your account.
Traders that use Scanz find more trades and execute them faster
2x
Decrease in clicks
1.6x
Faster time to trade