The Scanz Easy Scanner makes it easy to look at what’s going on not just across the entire market, but also within any individual market sector. You can break down stocks by broad categories like “Banking,” “Energy,” and “Health Services,” or get more granular by diving into specific sub-industries.
This categorization makes it easy to quickly spot the stocks that are taking off within any given industry. Let’s take a closer look at how you can put the Easy Scanner to work to find the hottest stocks in any market sector.
Narrowing Your Sector Search
When searching for hot stocks in a particular sector, the best place to start is with the Easy Scanner’s broad industry categories. Depending on which sector you’re looking at, there may be numerous sub-industries that you can use to narrow your search.
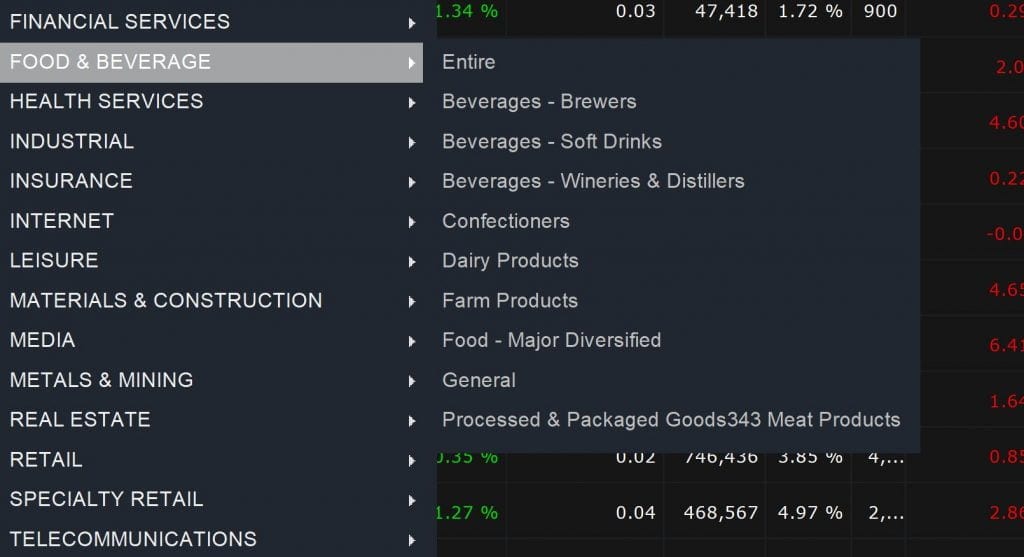
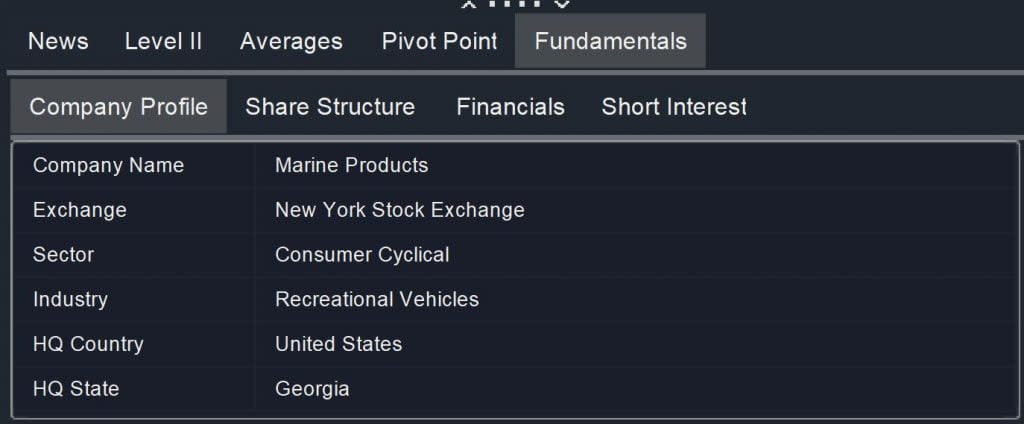
If you start out by scanning an entire sector and see a stock you’re interested in, opening up the stock will allow you to see what sub-sector it falls into. Go to Fundamentals, and then look for the Industry category under Company Profile. From there, you can return to the Easy Scanner and narrow your search to just that sub-industry.
Using this tiered approach to sectors allows you to first get a sense of what all the stocks in a broad category are doing. Once you have that information, you can narrow your scan to just the specific sub-sector that the company you’re interested in falls into to see how that company stacks up against its closest competitors.
Finding Hot Stocks: Rate of Price Change
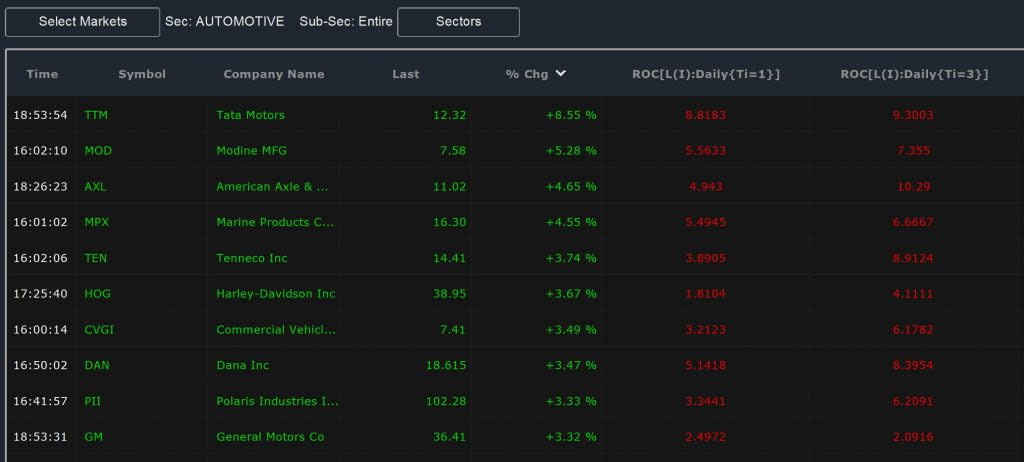
A hot stock, regardless of sector, is going to be going through a rapid price increase. There are a couple ways you can look for this using the Easy Scanner. Of course, sorting your scan results by the % Change column is a good place to start – you can see which stocks have made the biggest price movement on the day so far.
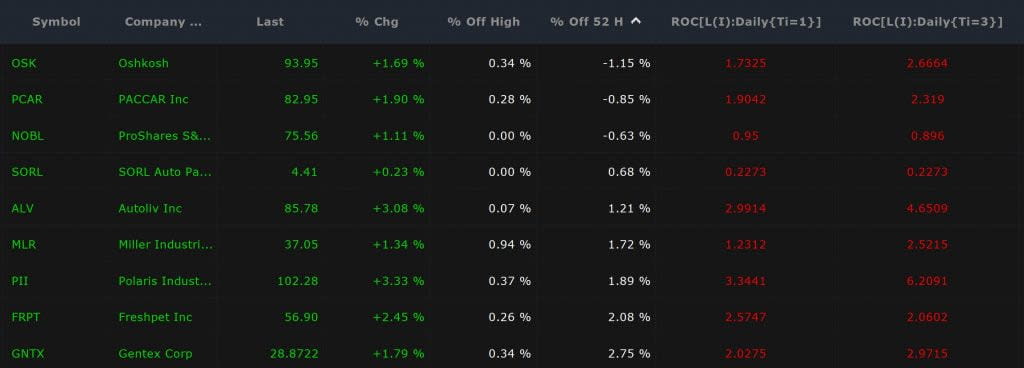
But, that doesn’t give you the whole story about how stock prices have changed beyond just today. This is where the Rate of Change indicator is extremely helpful. This indicator simply looks at the percent difference in stock price between now and a previous time – you get to decide whether that previous time is an hour ago, a day ago, or anything else.

The best thing to do to find stocks that are gaining momentum is to create two or more Rate of Change indicator columns. Set one to measure the rate of price change over the past day, and set another to measure the rate of change over three days or more. The shorter-term rate should be higher than the longer-term rate, indicating that the stock’s price rise is accelerating rather than losing momentum.
You can achieve something similar by creating columns for two short-term simple moving averages. Comparing these will confirm that the price has been rising for more than just one day and give you an idea of how fast.
Finding Hot Stocks: Setting New Highs
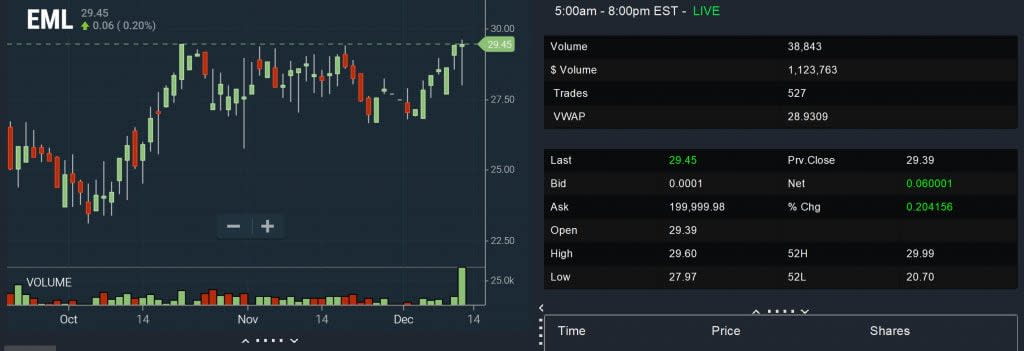
Another good sign that a stock is hot is when its price is setting new highs. This is easy to look for using the Easy Scanner’s % Off 52 High column. You’ll want to sort this column from high to low, since values closer to zero mean that a particular stock is closer to breaking through its 52-week price high. Approaching a 52-week high with an increasingly positive rate of change and a simple moving average are, combined, pretty strong indications that a stock is hot.
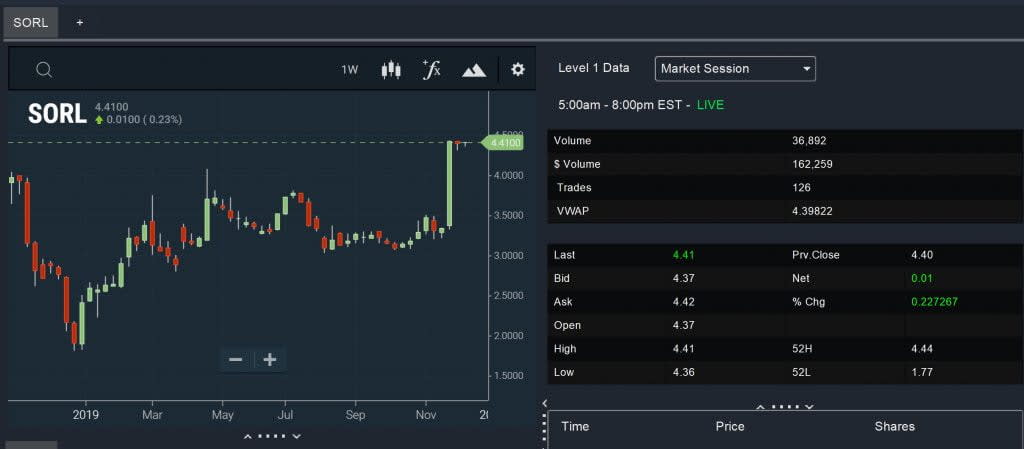
It’s also a good idea to check how a stock is trading relative to its intraday high. You can either display the current price and intraday high next to each other, or use the % Off High metric. Regardless, a hot stock should remain close to its intraday high.
Finding Hot Stocks: Increasing Volume
Importantly, you can confirm that a stock is hot by looking at how much trading volume it has for the positive price movement that you’re looking at. To see if a stock is trading with more volume than usual – a sign of broad support for its bullish movement – use the Average Daily Volume column.
You can display the absolute average daily volume next to the current volume. Or, better yet, use the Average Daily Volume Multiple metric. That way, you can see immediately whether a stock is trading with more or less volume than usual, and by how much.
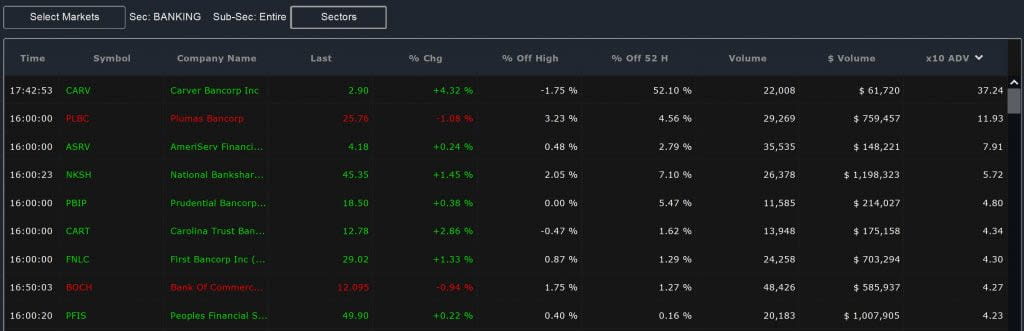
If you want to compare volume among stocks in a sector, use $Volume instead of Volume. $Volume normalizes share volume by the stock price, allowing you to more directly compare trading volume among stocks that trade at very different prices. This, along with the Average Daily Volume Multiple, is a good way to see whether the sector as a whole is receiving more attention from traders than usual, or whether a few specific stocks are seeing the majority of trading action.
Using the Easy Scanner to Spot Hot Stocks
The Easy Scanner’s Sector tab makes it easy to look at just stocks in a specific industry rather than at the market as a whole. That’s ideal if you want to know which companies are taking off in an industry that’s been in the news lately or if you believe a specific sub-industry is poised for growth.
When looking for hot stocks, it’s a good idea to start out looking at the Easy Scanner’s price and volume metrics to see which companies are experiencing sustained bullish action. From there, you can zero in on a specific sub-sector to see how hot stocks compare to their closest competitors.