We designed Scanz so that traders can quickly and easily jump in and start building stock screeners. But if you dove right into creating screens and analyzing trading opportunities, you may have missed some of Scanz’s less obvious features. Today, we’ll take a look at 10 Scanz features that you can take advantage of to build better scans and stay one step ahead of the market.
1. Saved Chart Templates
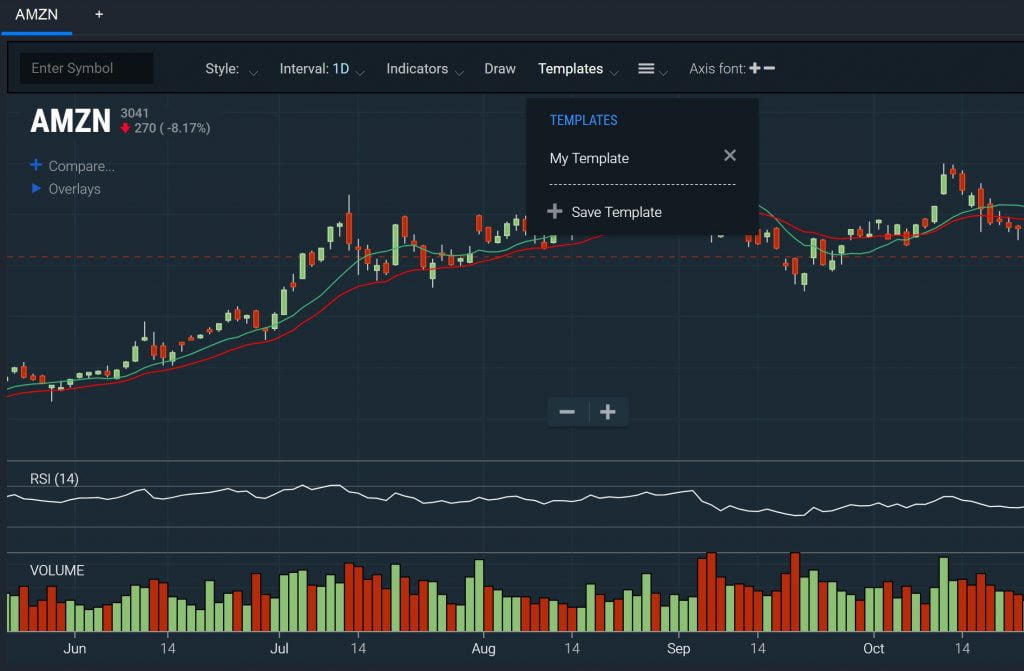
It’s common to run a stock screen, then pull up the Montage module to analyze the charts for individual companies that show up in your screener results. But it can be frustrating to have to repeatedly add indicators to your charts or change the chart timeframe.
That’s where Scanz’s chart templates come in handy. You can create different templates for intraday scans and end of day scans, or for short-term and long-term analysis. Just set up your chart the way you like it, then click Templates > Save Template. Give your new chart template a name, and then you can quickly load it anytime you open a new Montage window.
2. Multiple Scanner Windows
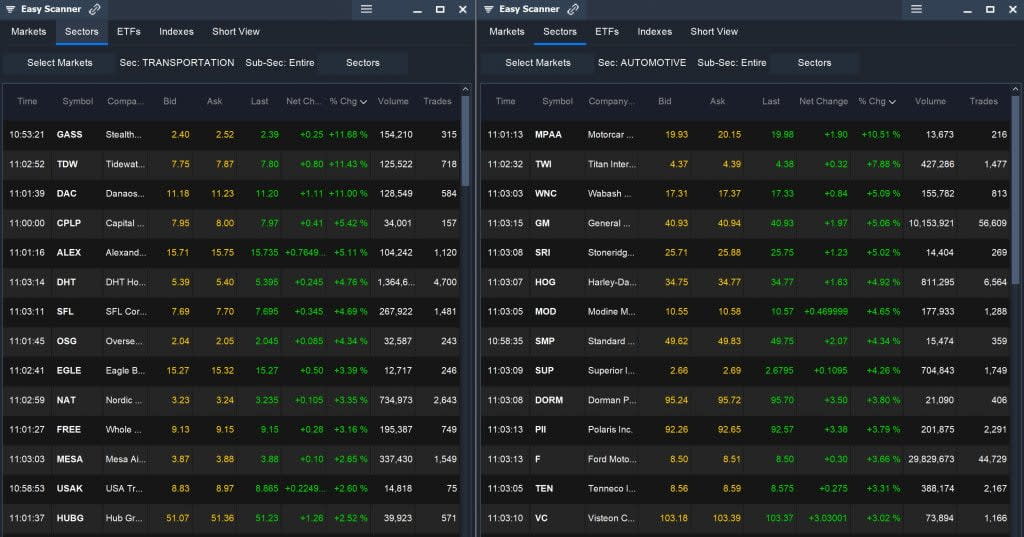
You’ve probably discovered that you can have two or more scanner windows open at once in Scanz. But you’re not limited to just having, say, one window of the Easy Scanner and one of the Pro Scanner. You can also have multiple windows of the same scanner open.
This comes in handy when you want to use the Breakouts Scanner for different types of alerts. For example, one Breakouts Scanner window could be set to show volume alerts, while another could flash price alerts. You can also use multiple Easy Scanner windows to look at different market sectors simultaneously.
3. Market Internals
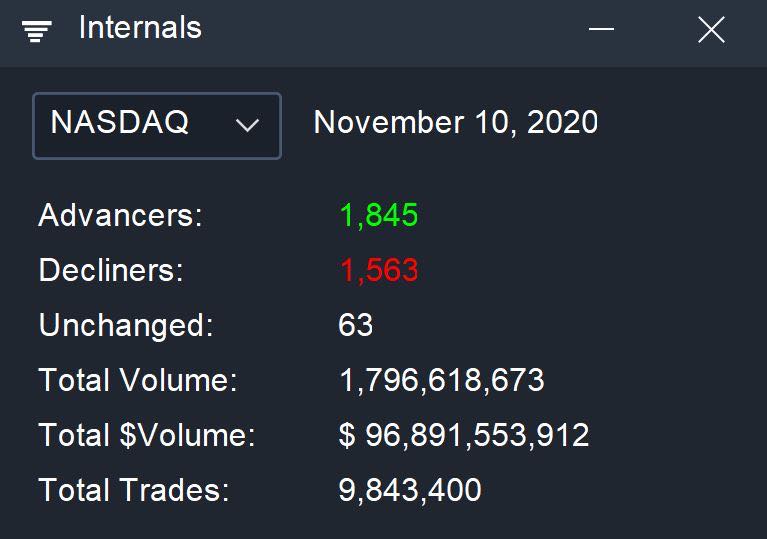
Scanz also offers data about what’s going on in the overall stock market so that you can quickly gauge sentiment and widespread trends. To access the Market Internals module, click on *Toolbox > Market Internals *from the main menu. You can see information about advancing and declining issues and the total trading volume on any of the major US exchanges.
4. Historical Prints
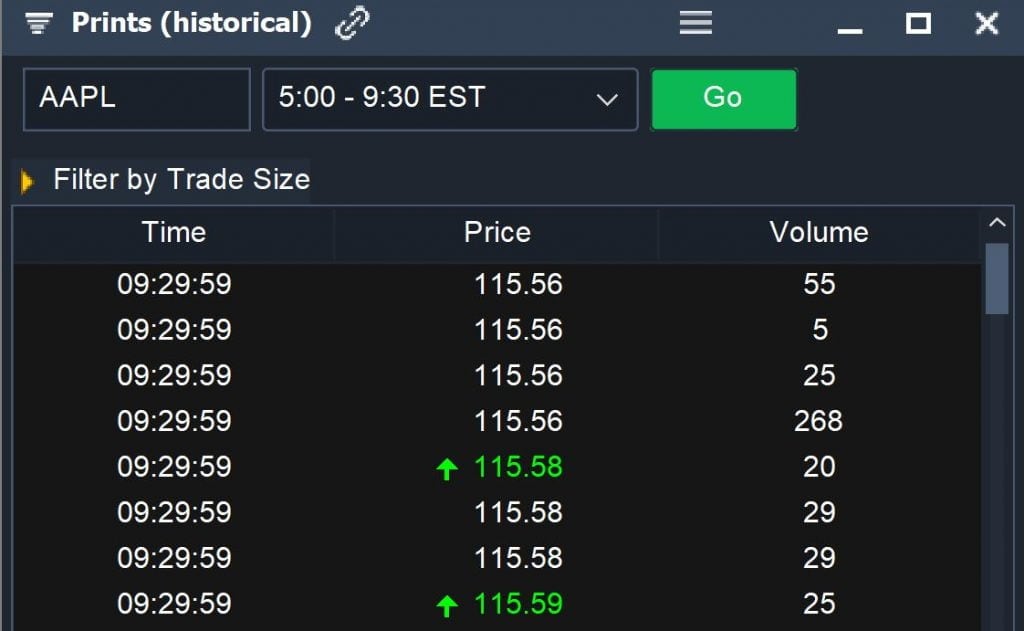
Another tool that traders often miss is Scanz’s Historical Prints module. You can dive back into the tape for any company to see every trade that was executed earlier in the day. Better yet, this module lets you filter by trade size so you can easily do a retrospective search for block trades.
To access the Historical Prints module, click on *Toolbox > Prints (historical) *from the main Scanz menu.
5. Scan Logs

The Pro Scanner has a little-known trick up its sleeve. After you create a scan, it automatically logs what stocks are entering and exiting the scan results list as it updates in real-time. You can use this scan log to spot potential trading opportunities as stocks slip in and out of your screen parameters.
To open the log, create a scan with the Pro Scanner and in the results window click the *Open Log *button in the top right corner.
6. Market Maker Activity Log
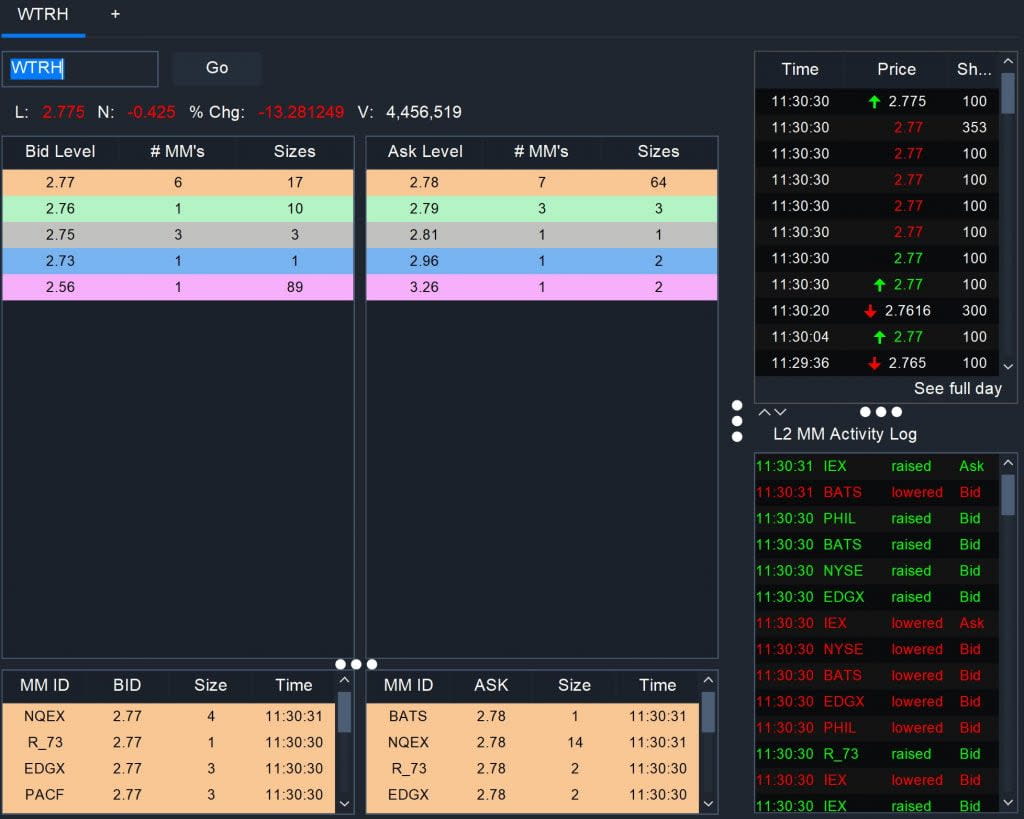
The market maker activity log, found inside Scanz’s Level 2 data module, can be a huge help for penny stock traders. With this log, you can easily see a log of every time the bid and ask prices for a stock are raised or lowered by a market maker. That gives you an edge in deciding whether you can get a better price for a stock and gives an inside look at how prices are changing in real-time.
To access the market maker activity log, open the Level 2 module by clicking *Toolbox > Level 2 *from the main Scanz menu.
7. Tabbed Windows
Real estate on your monitor is a valuable commodity when researching trades. You can save space and stay organized by using tabbed windows available inside the Level 2, Charts, and Montage modules.
For example, when looking at scan results, you can open companies’ charts in multiple tabs inside a single Montage window. This is especially helpful if you have multiple scans running, since each Montage window will contain tabs only for one scan’s results.
To open a new tab, just click the + button at the top of the Level 2, Charts, or Montage modules.
8. Email Alerts
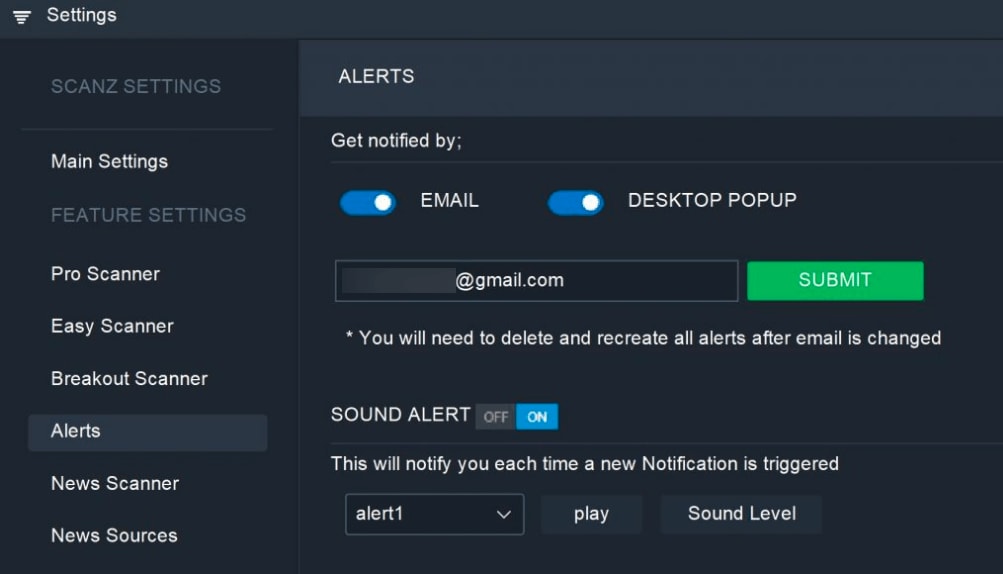
Scanz is capable of sending alerts to your desktop, email, or both. To set up email alerts, just go to *Settings > Alerts *and turn the email option on. Keep in mind that if you already have alerts queued up, they will need to be deleted and made again in order for them to trigger a message to your email.
9. Different Alert Sounds
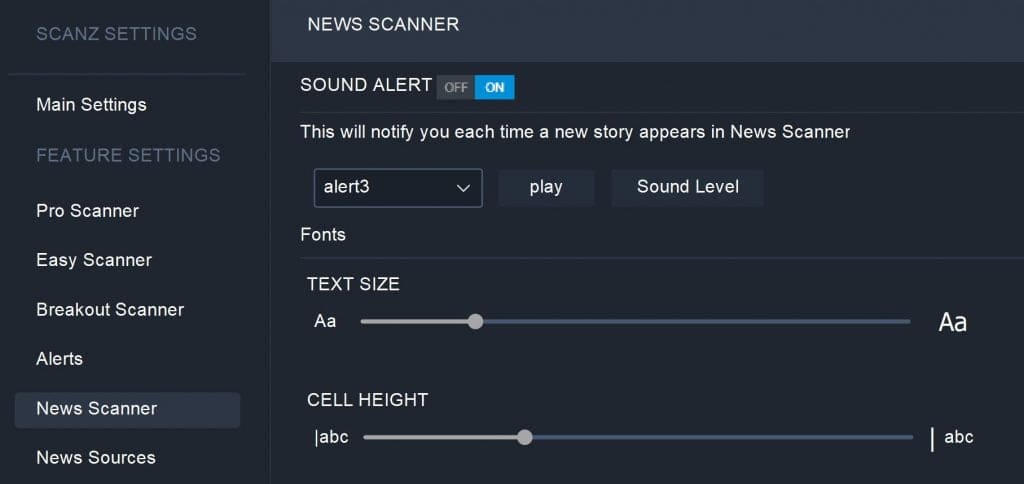
Scanz also enables you to use different sounds for different alerts. That way, you know right away whether you’re being notified about a news alert or a price alert. You can set up the notification sound and volume in your settings, right below the options for email alerts. Then choose what alert to use for news under the News Scanner settings.
10. Keyword-based News Scans
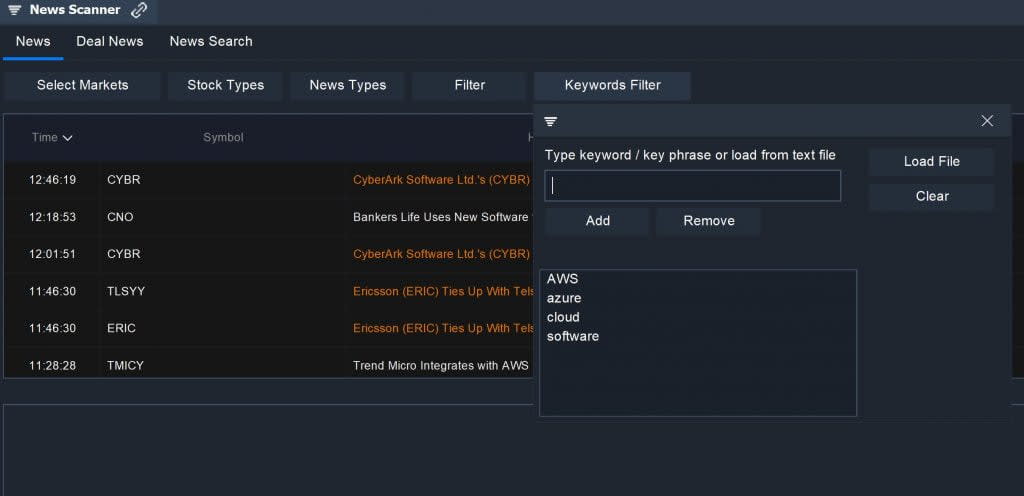
Another useful feature Scanz offers is the ability to create news scans based on keywords. This is helpful for creating scans that look for all companies in a specific sector, that are affected by a specific event, or that are operating in an emerging field. For example, you can look for companies involved in deploying 5G technology by scanning for new stories that include the keywords “5G,” “cellular data,” and “networks.”
To set up a keyword-based news scan, open the News Scanner and click the *Keywords Filter *button. From there, you can enter keywords manually or import a list of keywords from a text file.
Conclusion
Scanz makes it easy to organize your stock analysis, dive deep into specific companies, or stay on top of the market with alerts. Try out these 10 features today to see how they can help you get the most out of Scanz.
Related Reading:
Ready to start scanning? Try for free and choose the plan that fits your workflow.