What is Ross Cameron’s trading strategy?
Ross Cameron, who founded Warrior Trading, day trades small-cap stocks that are already making a big move on news. He narrows the whole market to a handful of names each morning with five stock-selection criteria, waits for the first pullback after the stock’s first surge, and buys the first candle that makes a new high, with his stop at the low of that pullback (his bull flag guide, his 2025 full training).
This page describes only what he teaches in public, in his videos and on his site, and links each rule to where he says it. Scanz is not affiliated with Ross Cameron or Warrior Trading, and neither has reviewed or endorsed this page. What Scanz adds is the scan: his five criteria are native Scanz filters, set up as one template.
Why it works, in his terms. The five criteria describe a supply and demand imbalance. A float under 10 million shares means few shares exist to trade; a headline brings a crowd of buyers to them on the same morning; five times normal volume shows the crowd has arrived; a price of $2 to $20 keeps it in reach of retail accounts, who are the ones chasing 20% to 30% moves. In his telling, nearly every day some stock makes a move like that, and the ones that do share these traits (momentum strategy).
Why the first pullback. The first surge is made by whoever saw the news first. When it pauses, the early buyers take profits and the stock dips for two or three candles on lighter volume. Traders who missed the first leg are waiting for that dip to end, and the first candle to trade above the previous candle’s high is the moment they all buy at once. He describes volume spiking at exactly that candle (momentum strategy). The pullback’s low is where the idea is wrong: if the dip keeps going, the buyers did not come back.
What are Ross Cameron’s five stock-selection criteria?
In his 2025 full training he lists five, and says a stock should meet all of them, and each one closely (video):
- Relative volume of 5 times or more. The day’s volume at least five times the stock’s 50-day average. He says these are the stocks he made the most money on.
- Already up. At least 2% in pre-market, with 10% and higher his real cutoff.
- Price between $2 and $20. Low enough that a $1 move is a large percentage, high enough to leave out sub-$2 stocks.
- Float under 10 million shares. The number of shares available to trade. Lower is better: the less supply, the less buying it takes to move the price.
- A news catalyst. Earnings, clinical trial results, an FDA decision: the event that brings the volume in the first place.
He grades every setup by how many it meets: all five is A quality, four is B, three is C. He trades A quality, and says accuracy falls as the standard drops to B and C, which is what happens on a losing morning when a trader starts taking anything that moves (video).
The numbers have changed over the years. His older momentum guide on the Warrior Trading site asks for a float under 100 million (under 20 million ideal) and relative volume of only 2 times, measured against the average for that time of day (momentum strategy). A 2024 post gives $2 to $20, up 10%, 5 times relative volume and a float under 20 million (bull flag post, 2024). The 2025 training tightens the float to 10 million. This page uses the 2025 set, which is also what the Scanz template uses; the variations section shows how to widen the float to 20 million.
How do you scan for his five criteria?
He runs his criteria through real-time scanners every morning: they search every listed stock and leave him five to ten names (video). In the Scanz real-time stock scanner all five are native filters, and Discover has them set up as one template, Small-Cap Momentum. These are its rules exactly as the template stores them.
The scan · Data Scanner · Regular hours, 9:30 am–4:00 pm ET
Small-Cap Momentum
| Rule | Setting | Why it's there |
|---|---|---|
| Last Price | ≥ $2 and ≤ $20 | His price range: big percentage moves without the sub-$2 stocks, where a one-cent spread is a large slice of the price. |
| Float | ≤ 10,000,000 shares | His supply rule. A few million shares of buying can take every offer. |
| Relative Volume (50-day average) | ≥ 5 | Today's volume at five times or more the stock's average day over the last 50, his definition. It says the crowd is already there. |
| % Change (regular hours vs previous close) | ≥ 10% | His real cutoff for 'already up'. |
| News Count (4 hours) | ≥ 1 | At least one headline or filing in the last four hours: the catalyst, checked by the scan instead of by eye. |
The list fills from 9:30 am ET: % Change counts regular hours only, so a stock gapping 40% at 8:00 am is not on it yet. Expect zero to five names; an empty list at midday is normal. Clicking a row opens the chart beside the list in QuickView in the web app, where the entry is read.
7 days of Pro free, card required. After day 7 it renews on the plan chosen at sign-up, Starter at $89/month or Pro at $199/month, unless you cancel in the app. Starter keeps one Data scan, which is enough for this one.
How relative volume is measured here, if you build it yourself. Relative Volume in Scanz is configurable, and its default compares the current candle with the previous candle, which is not what he means. The template sets it to the regular session against the average of the last 50 days (the builder shows the badge RH[/50]), so it reads today’s regular-hours volume so far against the stock’s average day. Pre-market volume does not count toward it, and it is not adjusted for time of day: at 9:45 am a stock needs five times a whole average day’s volume already, which makes the list stricter early in the session than a time-of-day relative volume would be. If you rebuild the scan from scratch, set the Relative Volume filter’s baseline to the average of 50 days, or you are screening for something else (filter reference). One more trap: the RVOL column the template shows in the grid is labelled RVOL RH [/20], a 20-day reading, so a row can show 4.6 in that column and still have passed the 50-day rule, or the other way round.
News Count looks back four hours at most. A stock that ran on a 7:00 am headline drops off the news rule by about 11:00 am even if it is still moving. For older catalysts, the News Scanner covers the whole day.
The extreme tier: float rotation. Float rotation is today’s volume divided by the float. A stock that has traded 100% of its float or more has had every free share change hands at least once. He makes the same point about churn: a stock with well under a million shares to trade can still trade hundreds of millions in a day, because the same shares cycle through the crowd (video). In Scanz, Float Rotation is a multiple, not a percentage: it reads 1 when the day’s volume equals the float. So the 100% tier is Float Rotation (Regular Hours) ≥ 1, added as a filter or a column in your copy of the scan (it sits with Float in the Capital Structure filters). The Float Rotation Trigger signal in Discover fires the moment a stock’s regular-hours volume passes its float, so it tells you when a name crosses into that tier. A name on Small-Cap Momentum with rotation of 1 or more is the crowded end of the list: the biggest moves and the hardest reversals (low float guide).
Getting told about the trigger. The scan finds the stock; it does not tell you when the pullback ends. Two things help. The HOD Break - Momentum signal adds a timestamped row each time a stock up 5% on twice its normal volume prints a new regular-session high, so a name that pulled back and is pushing again shows up as it happens (high of day guide). And the Bull Flag Breakout template in Discover (Breakouts & Highs) keeps the same universe (with a 20-day relative volume) and adds three price rules on 1-minute bars: the bar two back made a higher high than the last bar, and the current bar’s high is above both, on volume above its 20-bar average. That is a rough stand-in for “first candle to make a new high”. It does not measure the pole, how deep the pullback went or whether it held VWAP.
Scanz does not recognise chart patterns. No filter can see a bull flag, and neither can his: “Scanners alone cannot find patterns on charts,” he writes (momentum strategy). The scan narrows the market to the stocks that meet his five criteria. The entry is read off the chart.
What are the entry, stop and exit rules?
These are his bull flag rules, from his guide to the pattern, his momentum strategy page and his 2025 training. The card is the first-pullback trade most traders mean when they say his strategy.
The setup on one card
- In play
- Meets all five criteria (on the Small-Cap Momentum list); A quality only
- Time window
- 9:30 to 11:30 am ET on the 1-minute chart. After 11:30, 5-minute chart only.
- Setup
- A pole of one or more large green candles on high volume, then a pullback of 2–3 red candles on lighter volume that holds at least half of the pole and stays above VWAP
- Trigger
- The first candle to trade above the high of the last pullback candle. Know that price to the penny; if the next candle is red instead, wait.
- Stop
- The low of the pullback. If that is more than about 20 cents away, risk 20 cents and come back for a second try instead.
- Target
- A retest of the high of day. Take the trade only if that retest is at least twice the risk (2:1).
- Exit
- Sell half at the first target and move the stop on the rest to the entry. If it does not move right away, get out near break-even. Sell into a sudden spike.
- Size
- A quarter of full size until the day's profit reaches a quarter of the daily goal; daily loss limit equals the goal; no trade in 30 minutes, stop for the day
- Skip it when
- The pullback gives back more than half the move, runs 4–5 candles or more, comes on heavier volume than the pole, or breaks VWAP; there is no room for 2:1 below the high of day; it is the third pullback or later
The trigger, to the penny. He watches the high of the last red candle in the pullback. If it is $3.05, the moment the stock prints $3.06 is the new high and the entry; he is willing to pay a cent or two above. If the next candle goes red and dips further, he does not press buy and waits for the next candle to try again (video).
Why half the move. He treats a pullback that gives back more than 50% of the initial move as a sign of weakness, along with pullback volume heavier than the move up and a break of the 9-period EMA or VWAP (bull flag guide). Two or three red candles is normal; four or five and he starts to worry that buyers are not stepping in.
The 2:1 test before the trade. The stop distance and the high of day decide whether the trade is worth taking. With the entry at $3.06 and the stop at $2.96, the risk is 10 cents, so the high-of-day retest has to be at $3.26 or higher. If the high of day sits below $3.26, there is no room for 2:1 and the trade is not taken (video). An entry too close to the high is the most common way this rule says no.
Why 20 cents. He prefers a stop of about 20 cents, which needs 40 cents to pay 2:1. If the pullback’s low is 50 cents away the trade needs a dollar, which is a much bigger ask, so he may use a 20-cent stop and try again if it stops out (momentum strategy).
The exits. At the first target that pays 2:1 he sells half and moves the stop on the rest to his entry. Before that first sale, a candle that closes red is an exit signal; after it, he holds through red candles while the break-even stop holds. A candle that spikes far above the rest is an “extension bar”, and he sells into it. He also follows what he calls “breakout or bailout”: if the stock does not move up right after the entry, he gets out, near break-even (momentum strategy, bull flag guide). A large seller showing on Level 2 or a run of selling in time and sales is reason to sell on the bid.
First and second pullbacks only. He says first pullbacks are usually the strongest, on any timeframe, and that he will trade the first and the second but gets cautious by the third (video). By then most of the buyers have bought, the morning’s holders are sitting on large profits, and the move is old.
How does he size trades and limit losses?
The 2:1 ratio does the work. His argument is arithmetic: the profit-to-loss ratio sets the accuracy you need just to break even (video).
| Average winner : average loser | Break-even accuracy |
|---|---|
| 1 : 2 (risk $2 to make $1) | 67% |
| 1 : 1 | 50% |
| 2 : 1 (his minimum) | 33% |
| 3 : 1 | 25% |
He describes his own early trap as the first row: selling winners after a few cents for fear of giving them back and holding losers hoping they come back, which needs two winners out of three just to stay level.
Size from the stop, not the account. Decide the dollars you will lose if the stop is hit, then divide by the distance to the stop. His example: a 20-cent stop with $500 of risk is 2,500 shares (momentum strategy). The share count changes from trade to trade; the dollars at risk do not.
A quarter size until there is a cushion. He caps his size at a quarter of his full position until he has made a quarter of his daily goal, which usually takes one or two good trades. If the market is cold and he never gets there, he stays at a quarter size all day. If he makes the cushion and gives it back, he goes back to a quarter or stops. His maximum loss for the day equals his daily goal, so a cold start at quarter size can absorb four or five losses before that limit (video).
Hot market, cold market. The quarter-size rule is how he tells the two apart without guessing. On a hot morning the first one or two trades build the cushion and he is at full size early, and he keeps trading past his goal while the A-quality setups keep coming. On a cold morning he never earns the cushion, stays at a quarter size, and stops sooner: “if I haven’t picked up a trade in 30 minutes then I say I’m calling it,” he says in the same training (video). He adds that a hot market forgives taking B-quality setups and a cold one punishes it, which is why losing on a cold day and then lowering the standard is the spiral he describes. The quarter scales to any account: with his $20,000 daily goal the cushion is $5,000; with a $200 goal it is $50, and the daily loss limit is $200.
Add to winners, never to losers. Once he has a cushion, he adds to a trade that is working and moves the stop to break-even. He calls averaging down into a loser the habit beginners have that he avoids. Losing days, in his account, come from running out of A-quality setups and lowering the standard, trading past his best hours, and trading out of frustration.
A real example: the list at 11:59 am ET on November 20, 2026
This is the scan on a live Friday, opened from Discover with Use template on a Pro test account. At 11:59:01 am ET it listed nothing.
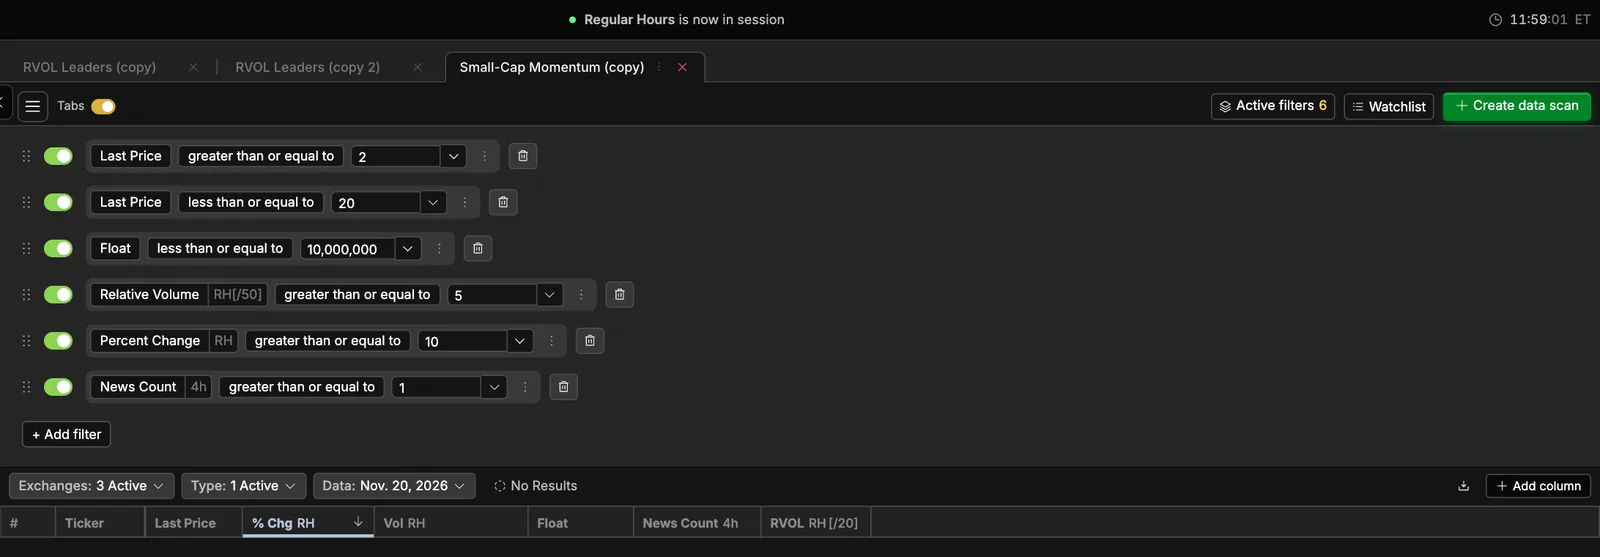
The market was not quiet. In the same minutes the RVOL Spike signal fired on MSS, MEDS, ABVX, ZJK, BILL, NIXX and BNAI as each one’s regular-hours volume passed five times its 20-day average, and the RVOL Leaders scan (3 times relative volume, up 2%, 250,000 shares) listed ten stocks at 11:58:39. Graded against his five criteria, none of the ten was A quality:
| Stock | Last price | Float | RVOL RH [/20] | News, last 4 h | Which of his criteria it failed |
|---|---|---|---|---|---|
| MSS | $1.19 | 389,834 | 433.18 | 0 | Price under $2; no news |
| ZJK | $1.00 | 9,791,133 | 701.92 | 1 | Price under $2 |
| NXAT | $0.58 | 1,353,790 | 691.19 | 0 | Price under $2; no news |
| MEDS | $1.04 | 1,489,624 | 53.19 | 1 | Price under $2 |
| SNSC | $0.41 | 13,909,000 | 38.62 | 0 | Price, float, no news |
| PMA | $1.46 | 5,543,180 | 30.84 | 0 | Price under $2; no news |
| RSSS | $2.18 | 25,933,999 | 5.88 | 0 | Float over 10 million; no news |
| BNAI | $3.21 | 5,041,252 | 5.60 | 0 | No headline in the last 4 hours |
| LVWR | $0.76 | 13,590,088 | 5.46 | 0 | Price, float, no news |
| YSWY | $20.30 | 16,099,858 | 3.36 | 0 | Price over $20; float |
Prices, floats, relative volume and news counts are as the RVOL Leaders grid showed them at 11:58:39 am ET. That grid’s change column covers the last 15 minutes, not the day, so the 10% test is not in the table.
What it shows. The stocks with the most unusual volume at midday were mostly under $2. MSS had traded 27.8 million shares in regular hours by 11:53 against a float of 389,834, about 71 times its float, and his price rule takes it off the list before the chart is opened. The one name inside his price and float range, BNAI at $3.21 with a 5 million share float, had no headline in the previous four hours, which makes it B quality at best. His rule for that is to pass, and the scan, empty, said the same.
What it does not show. These captures began at 11:53 am ET, after the window he trades, so they say nothing about what the list held at 9:30. A midday list that is empty is common, and the template’s own notes say so. The trade on this page, the first pullback, needs a stock on the list and a chart; on November 20 at noon there was no stock.
Variations: pre-market, flat tops, the afternoon and wider floats
Pre-market gappers. His criteria include being up in pre-market, and the stocks that fit them often gap before the bell. The template counts regular hours only, so it shows nothing before 9:30. For the pre-market version, copy the scan and switch % Change to the Pre-Market session (the same filter, a different session); the pre-market scanning guide covers what the pre-market list can and cannot show, and gap and go the trade at the open. Pre-market liquidity is thinner, so the same 20-cent stop is harder to get filled at.
Flat top breakout. His second favourite pattern: instead of dipping, the stock consolidates within a few cents of the high under a large seller, then breaks through. The entry is the break of that flat top, which is the high of day, so it is more extended than a bull flag; he still sets the stop at the low of the pattern and gets out at once if the stock cannot hold the breakout level (bull flag guide).
After 11:30 am ET. He focuses on 9:30 to 11:30 and slows down after the first two hours; after 11:30 he trades only off the 5-minute chart because the 1-minute chart gets too choppy (momentum strategy). A news spike in the afternoon can bring a stock into play, and the first pullback on the 5-minute chart is the same trade, with wider stops and fewer shares.
Micro pullbacks. On fast movers he scalps “micro pullbacks”, small flags on the 10-second and 1-minute charts (bull flag guide). The rules are the same, compressed into seconds. Scanz charts start at 1 minute, so the 10-second version needs a platform with seconds charts.
Wider float and price. For more names, raise Float to 20,000,000 (his 2024 number) in your copy of the scan. Expect more candidates, smaller moves and more orderly pullbacks. Lowering the price floor below $2 brings in stocks where the spread can be a large share of a 10-cent stop.
Why does the strategy fail?
Most momentum trades do not work, which is why the rules put the loss first. The failures look alike:
- The pullback is a reversal. It gives back more than half the move, keeps printing red candles, or comes on heavier volume than the run up. Sellers are in control, and the first green candle is a bounce, not a new leg.
- No room. The entry is close to the high of day, so the first target cannot pay 2:1 before it reaches the sellers sitting at the high.
- The news was not news. A rehashed press release or a minor filing triggers the News Count rule just as a real catalyst does. The scan counts headlines; reading them is still your job.
- A halt. Low-float stocks moving fast get paused under the Limit Up-Limit Down rules when they move outside their price band, for at least five minutes (SEC), and can reopen far from your stop. A stop does not protect you through a halt. Scanz has no halt data.
- Dilution. A small company whose stock just doubled can sell new shares into the move. The float filter shows today’s float, not a filing that adds to it this afternoon.
- The third pullback. By the third dip the move is old and most buyers are in.
What the scan cannot see: the pattern itself, the 50% retracement, the depth of the pullback, the spread, what is sitting on Level 2, or a halt about to happen. It hands you the stocks that meet the five criteria; the chart, Level 2 and time and sales decide the trade.
The base rate. He says so himself at the top of his videos: day trading is risky, most traders lose money, and his results are not typical (video description). In a study of everyone who day traded Brazilian equity futures for at least 300 days in 2013–2015, “97% of them lost money” (Chague, De-Losso and Giovannetti, 2019). He advises proving a strategy in a simulator before trading it with real money. His own published results are his; this page does not claim them for anyone else.
The checklist before you take the trade
Before the first new high
- Does the stock meet all five criteria: $2 to $20, float under 10 million, up 10% or more, 5 times relative volume, news in the last four hours?
- Is it between 9:30 and 11:30 am ET (or, after 11:30, are you reading the 5-minute chart)?
- Did it make a pole of large green candles on high volume?
- Is the pullback 2–3 red candles on lighter volume?
- Has it held at least half of the pole, and stayed above VWAP?
- Do you know the trigger to the penny: one cent above the last pullback candle's high?
- Is the stop at the pullback's low, about 20 cents away or less?
- Is the high-of-day retest at least twice the risk away?
- Is this the first or second pullback, not the third?
- Are you at a quarter of full size until the day's cushion is a quarter of your daily goal?
- Is the day's loss still inside your limit, and are you ready to sell half at the first target?
- Has an A-quality setup come along in the last 30 minutes? If not, are you done for the day?
Questions traders ask
What are Ross Cameron's five pillars of stock selection?
In his 2025 training: relative volume of at least 5 times the 50-day average, up at least 10% (2% in pre-market is the floor he names), a price of $2 to $20, a float under 10 million shares, and a news catalyst. A stock that meets all five is what he calls A quality; four is B and three is C, and he trades A quality.
What scanner does Ross Cameron use?
He uses the scanners Warrior Trading built for its own software, Day Trade Dash, and says on his site that scanners are the most valuable tool a day trader has. Any real-time scanner with float, relative volume, session-aware percent change and a news filter can run his five criteria; in Scanz they are the Small-Cap Momentum template.
How do I set up Ross Cameron's scanner in Scanz?
Open Discover, choose the Data Scanner, open the Momentum tab and click Use template on Small-Cap Momentum. It is Last Price $2 to $20, Float of 10 million or less, Relative Volume of 5 or more against a 50-day average, % Change of 10% or more in regular hours and News Count of at least one in the last 4 hours. For the extreme tier, add Float Rotation (Regular Hours) of 1 or more: rotation is a multiple, and 1 means the whole float has traded.
What relative volume does Ross Cameron use?
Five times or more, which he defines as the day's volume against the stock's 50-day average. His older site guide used 2 times against the average for that time of day. In Scanz the Relative Volume filter defaults to comparing with the previous candle; the Small-Cap Momentum template sets it to the average of 50 days, which matches his definition.
Does the scan find bull flags?
No. Scanz has no chart-pattern recognition, and he says scanners cannot find chart patterns either. The scan finds the stocks that meet his criteria; the pullback, the trigger and the 50% rule are read off a 1-minute or 5-minute chart.
What time of day does he trade?
His published focus is 9:30 to 11:30 am ET, with the 1-minute chart, and only the 5-minute chart after 11:30. His criteria also look for stocks already up in pre-market. The Scanz template counts regular hours only, so for the pre-market list switch its % Change to the Pre-Market session.
Where does the stop go on his bull flag?
At the low of the pullback. He prefers stops of about 20 cents, and if the low is much further away he may risk 20 cents and come back for a second try rather than widen the stop.
What is a micro pullback?
His name for a small bull flag on a 10-second or 1-minute chart, usually a dip of one or two candles in a stock that is moving fast. Same rules, much shorter: the first candle to make a new high is the entry and the low of the dip is the stop.
Is Scanz affiliated with Ross Cameron or Warrior Trading?
No. This page describes the method he teaches publicly, with links to where he teaches it, and shows how his published criteria map onto Scanz filters. Neither he nor Warrior Trading has reviewed or endorsed it.
Does the Ross Cameron strategy work?
His results are his own, and he states they are not typical and that most day traders lose money. This page claims no win rate for the method. What the rules control is the loss: fixed at the pullback's low before the trade, taken at quarter size until the day is green.