Swing trading involves capitalizing on potentially large price movements that happen over a few days or a few weeks. Swing traders can use a number of different strategies to spot opportunities, but most traders rely heavily on technical indicators like moving averages to find trades.
As a result, the Scanz Breakouts module and Pro Scanner are perfect for swing traders looking to get ahead of the curve. Let’s take a look at how you can use these scanners to find different swing trading setups.
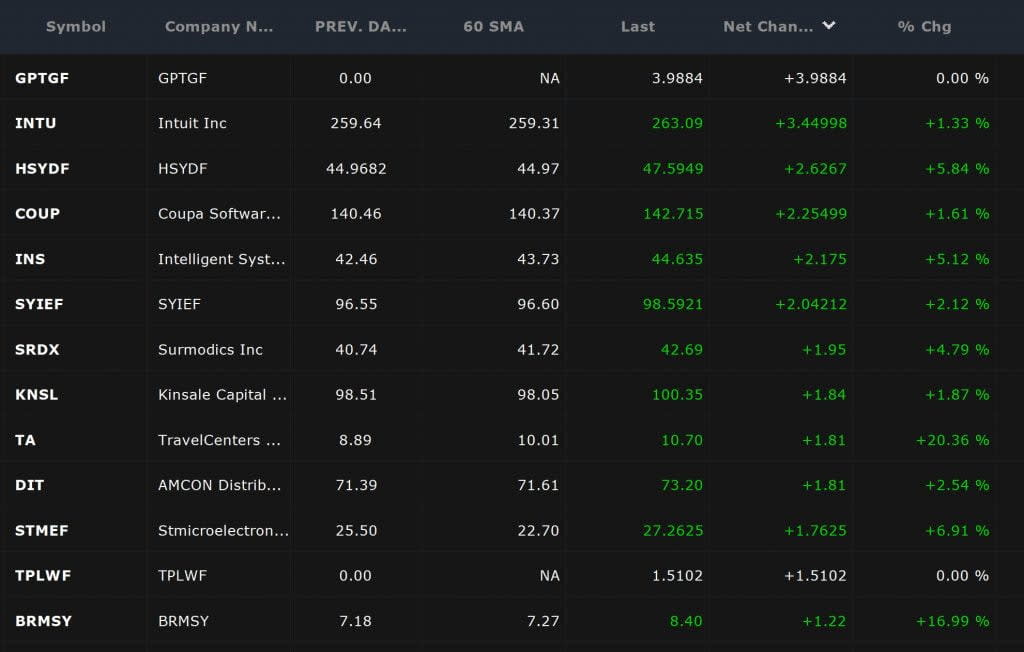
Swing Trading with the Breakouts Module
The Breakouts module is a great place for swing traders to start in Scanz. The Price Breakouts filter allows you to quickly spot stocks that are crossing above or below a moving average, which is a starting point for many swing trading strategies. Even better, you can use the Breakouts module to show whether those same stocks are trading with above-average volume, a good sign of a supported move, or whether they are hitting new highs or lows.
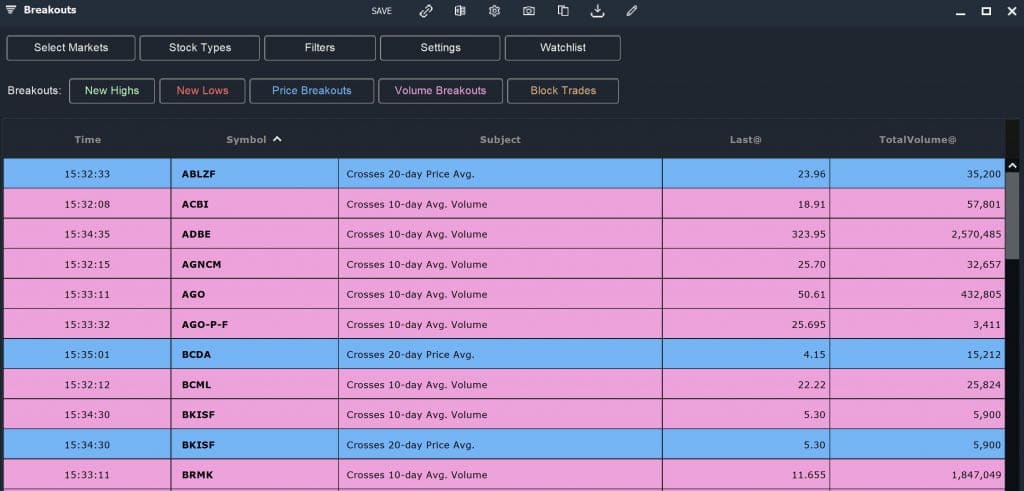
One of the other nice things about using the Breakouts module to look for swing trading opportunities is that you can search only your watchlist stocks rather than the whole market. This allows you to focus in on stocks that you’re already keyed into or on stocks from a particular market sector.
Spotting a Trend Break
If you want more control over your swing trade scans, you’ll want to turn to the Pro Scanner. Here, you can easily look for price breakouts that occur in conjunction with significant movements in technical indicators.
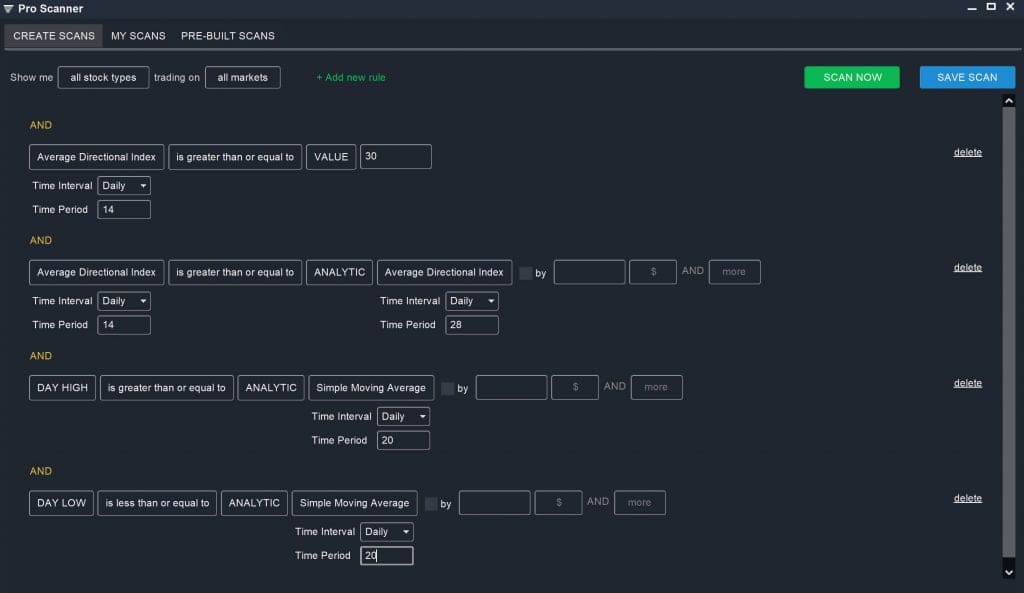
One very popular trading swing strategy that you can use the Pro Scanner for is the Holy Grail strategy. With this setup, you’re looking for stocks that have been trending strongly up or down, but that are now pulling back and crossing over a 20-day moving average. You can create this scan using four rules:
Average Directional Index (Daily, 14) is greater than or equal to VALUE 30
AND
Average Directional Index (Daily, 14) is greater than or equal to Average Directional Index (Daily, 28)
AND
DAY HIGH is greater than or equal to ANALYTIC Simple Moving Average (Daily, 20)
AND
DAY LOW is less than or equal to ANALYTIC Simple Moving Average (Daily, 20)
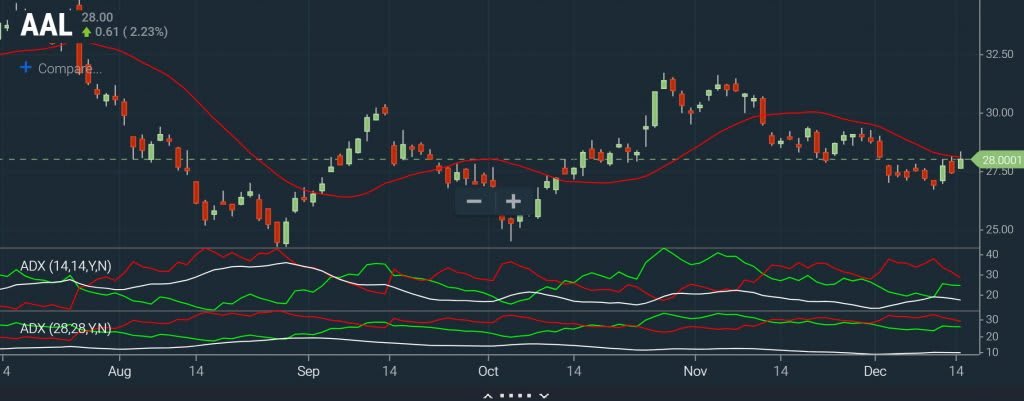
The first two rules look for stocks that have been trending strongly over a period of four weeks, with the trend increasing over the past two weeks. The second two rules then scan for stocks for which the daily candlestick is straddling the 20-day moving average, indicating a pullback from the trend that may just be getting started.
Moving Average Breaks
Other common swing trade strategies look at moving average breaks. To spot a moving average break, you’ll need to first decide what timeframe you want to look at. This depends somewhat on your trading timeframe – intra-week traders may want to look at 10- or 20-day moving average breaks, while longer-term swing traders will look at 50-day moving average breaks.
In any case, a moving average break occurs when a stock that has been trading below its moving average suddenly crosses above it. To scan for this, use:
DAY OPEN is less than or equal to ANALYTIC Simple Moving Average (Daily, 50)
AND
LAST is greater than or equal to ANALYTIC Simple Moving Average (Daily, 50)
AND
PREV DAY OPEN is less than or equal to ANALYTIC Simple Moving Average (Daily, 50)
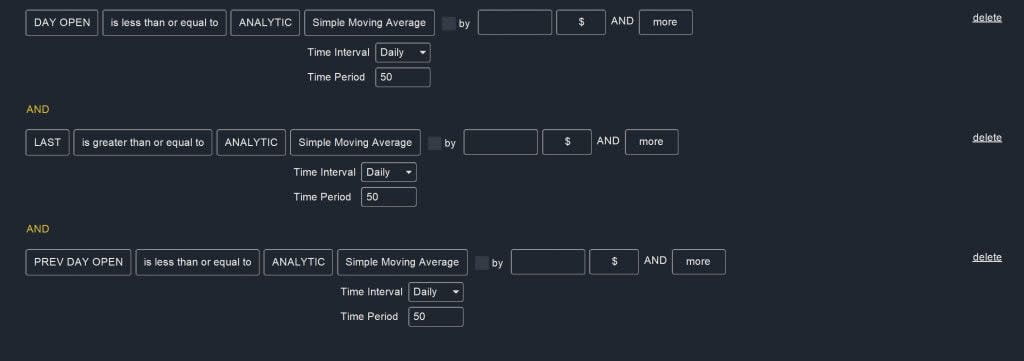
You may also want to add a volume filter to look for stocks that are trading above their average daily volume. That gives some confidence that the move above the moving average was strongly supported and is likely to be continued.
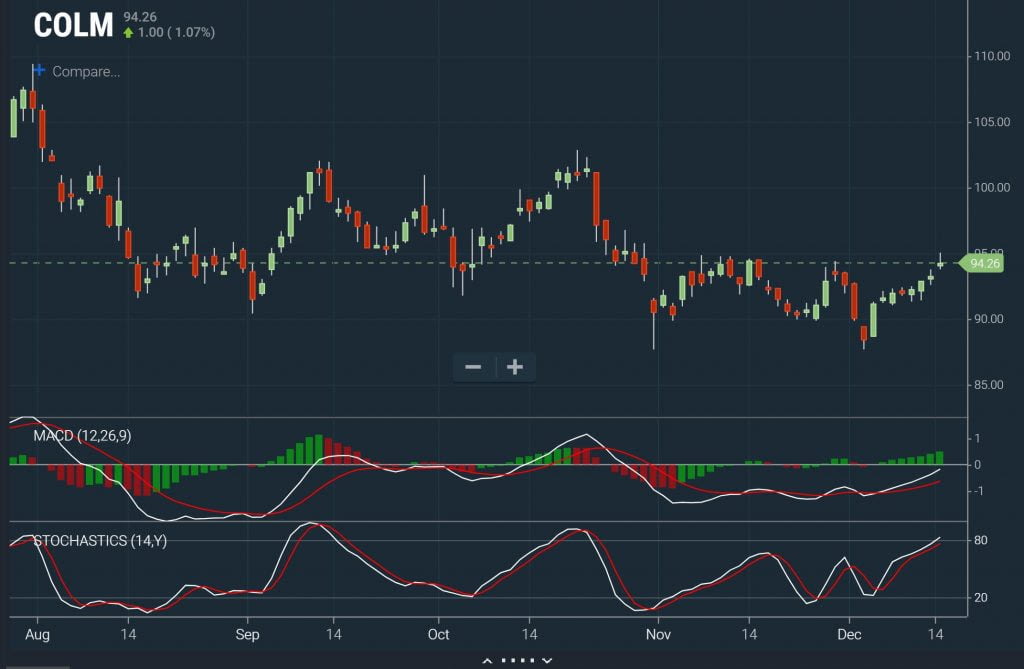
MACD and Stochastic Double-cross
Many swing traders use MACD crossovers alone as a strong indicator for trade entry or exit. But, you can also use the Stochastic oscillator to confirm the MACD signals and provide more confidence in an upcoming move. Importantly, these two indicators are measuring different things: MACD looks at how two moving averages are changing with respect to one another, while the stochastic oscillator looks at how a stock is priced relative to its recent trading range.
You can set up a scan for a bullish MACD cross like this:
Moving Average Convergence-Divergence is greater than or equal to ANALYTIC MACD Signal
AND
MACD Histogram is between 0 AND 0.2
The second rule helps to ensure that the cross occurred within the past day or two.
[Swing Trades – MACD Scan]
To look for a bullish stochastic crossover, use this scan:
Stochastic SlowK is greater than or equal to ANALYTIC Stochastic SlowD by 0.5 $ AND less
AND
Stochastic SlowK is less than VALUE 80
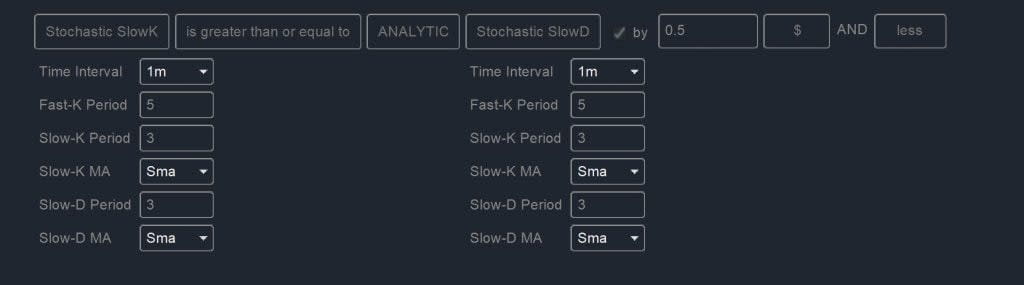
Combining these two scans will highlight stocks that experienced a double-crossover within the last day or two, which is a very powerful bullish signal.
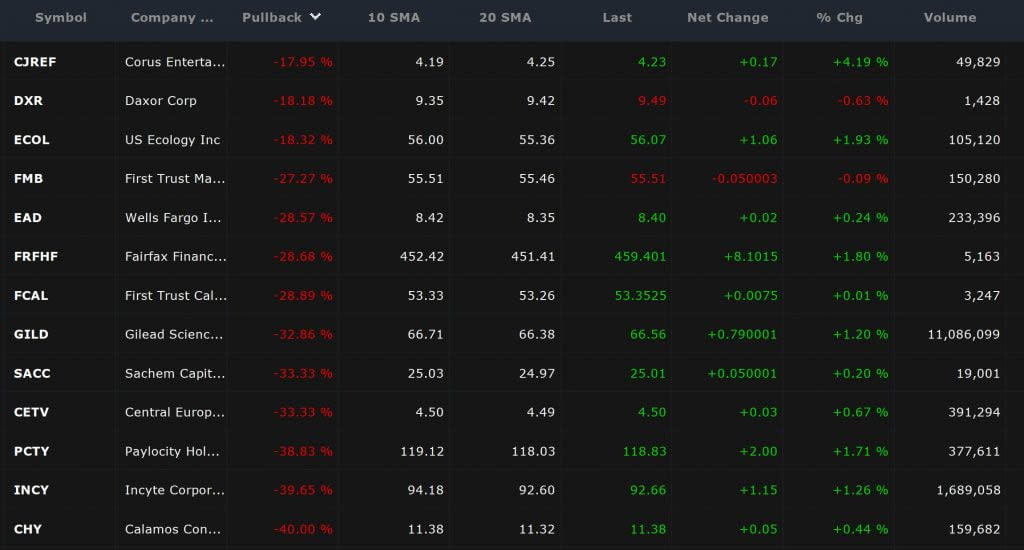
Scanning for Pullbacks
Another good swing trading opportunity is when strong stocks pullback, possibly to consolidate before reaching even higher levels. You can spot these stocks by looking for companies that have retraced below a short-term moving average but remain near their medium-term high. For example:
LAST is less than ANALYTIC Simple Moving Average (Daily, 10)
AND
LAST is greater than ANALYTIC Simple Moving Average (Daily, 20)
AND
LAST is less than ANALYTIC 20 DAY HIGH by 5 % AND less
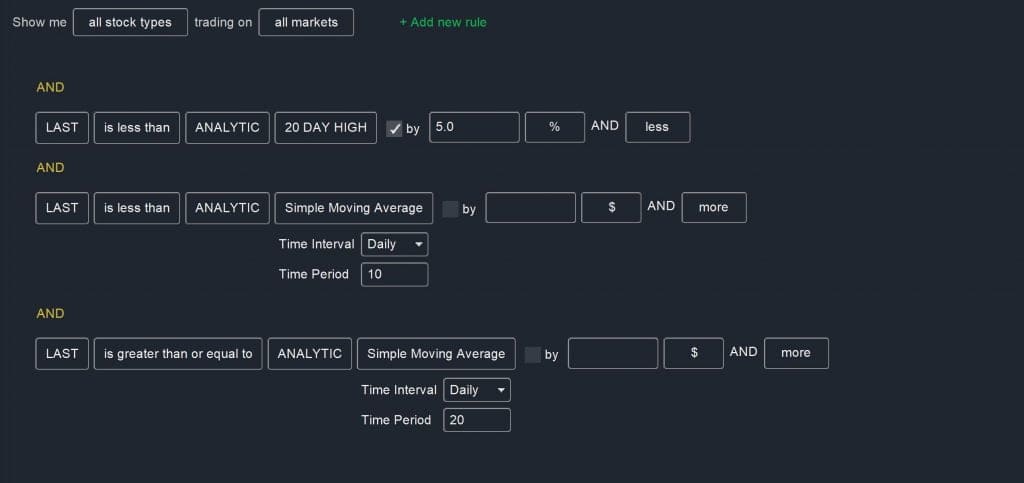
This scan looks for stocks that have dropped off their recent price advance, but remain relatively strong and within 5% of their 20-day high. You’ll want to keep an eye on other technical indicators and chart patterns to decide whether these stocks are likely to continue their previous upward trends.
Customizing Your Swing Trade Scans
Whenever you use the Scanz Pro Scanner to search for potential swing trades or another scanner , it’s a good idea to customize your scan to suit your trading style. You can add in filters for price, market cap, or volume to see results only for stocks that are in your price range and that see a relatively large degree of trading action.
Scanz makes it easy for swing traders to spot potentially profitable setups. Whether you use one of the scans above or bring your own swing trading strategy, the Breakouts module and Pro Scanner can help ensure you never miss a signal.