About Fibonacci Retracements
Fibonacci retracements are a set of ratios, defined by the mathematically important Fibonacci sequence, that allow traders to identify key levels of support and resistance for stocks. Unlike moving averages, Fibonacci retracements are fixed, making them easy to interpret. When combined with additional momentum indicators, Fibonacci retracements can be used to identify potential entry and exit points to trade on trending stocks.
Type of Indicator
Fibonacci retracements are used to indicate levels of support and resistance for a stock’s price. Although they are similar to moving averages in this respect, Fibonacci retracements are set by the extent of the previous bullish or bearish run and do not change each day in the current trend as moving averages do. Therefore, it can be significantly easier to identify and anticipate support and resistance levels from Fibonacci sequences.
Calculating Fibonacci Retracements
Fibonacci retracements are based on the Fibonacci sequence, in which each number in the sequence can be added to the previous number to produce the following number in the sequence. Dividing any number in the sequence by the following number yields 1.6180 – known as the Golden Ratio – while dividing any number by its predecessor yields 0.6180. Dividing any number in the sequence by a number two positions in advance yields 0.3820, while dividing any number by a number three positions in advance yields 0.2360. These ratios emanating from the Fibonacci sequence are found throughout nature, mathematics, and architecture.
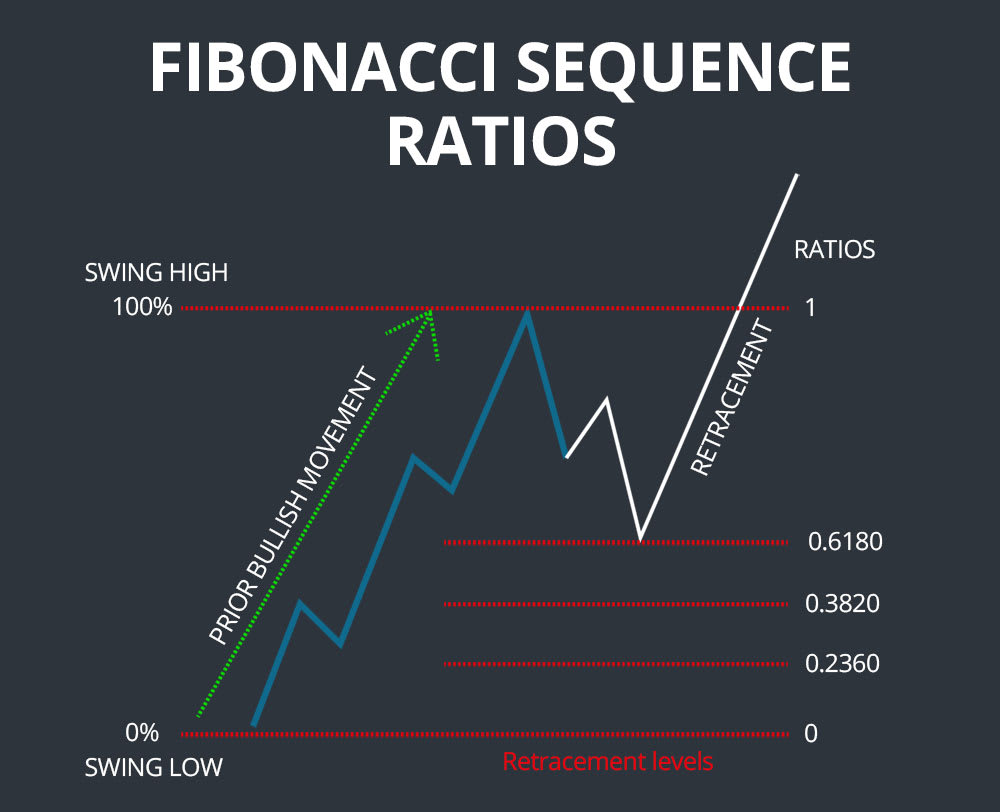
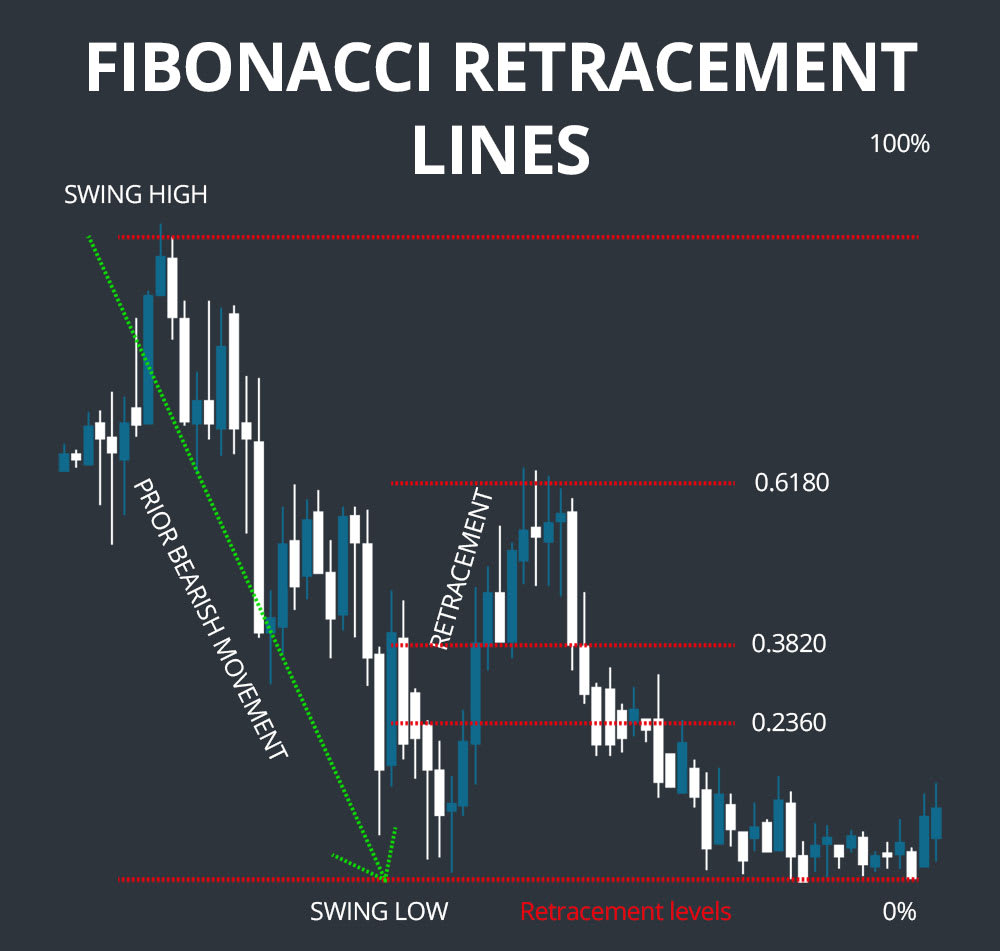
Retracement levels for a stock are drawn based on the prior bearish or bullish movement. To plot the retracements, draw a trendline from the low to the high within a continuous price movement – Fibonacci retracement lines should be placed at 61.80%, 38.20%, and 23.60% of the height of the line. In a bullish movement the retracement lines start from the top of the movement (i.e. the 23.60% line is closest to the top of the movement), whereas in a bearish movement the retracements are calculated from the bottom of the movement (i.e. the 23.60% line is closest to the bottom of the movement).
How to Trade with Fibonacci Retracements
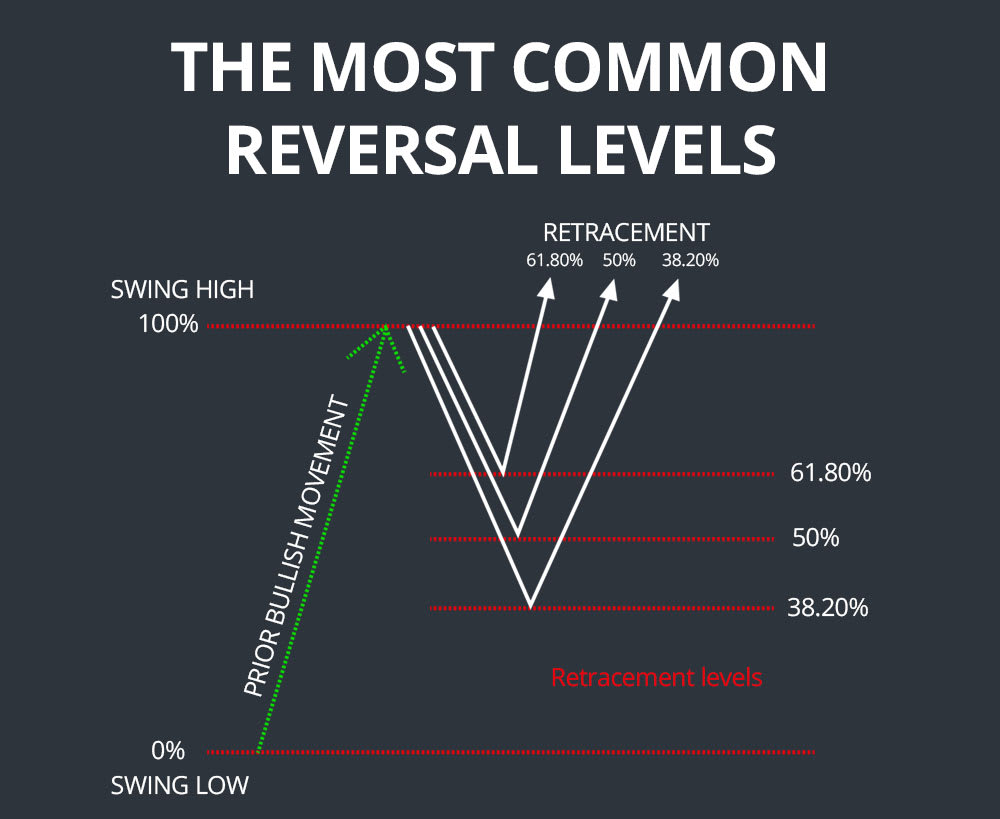
Once you have drawn a set of Fibonacci retracements on a chart, it is possible to anticipate potential reversal points where support or resistance will be encountered. If the retracements are based on a bullish movement, the retracements should indicate potential support levels where a downtrend will reverse bullishly. If the retracements are based on a bearish movement, the retracements should indicate potential resistance levels where a rebound will be reversed bearishly.
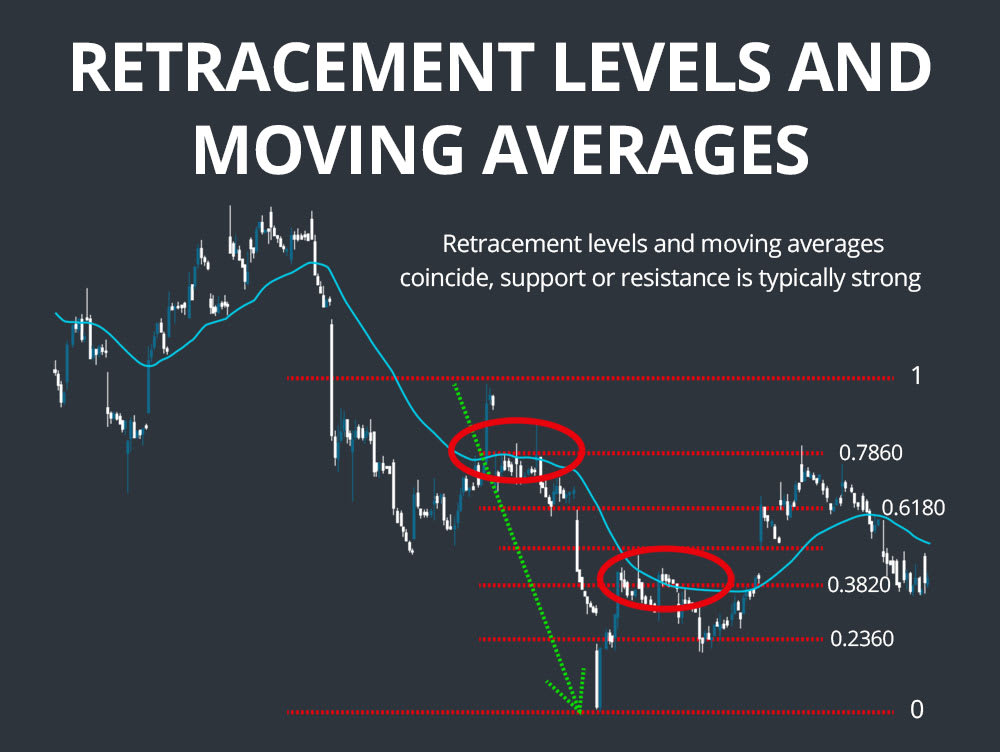
The most common reversals based on Fibonacci retracements occur at the 38.20%, 50%, and 61.80% levels (50% comes not from the Fibonacci sequence, but from the theory that on average stocks retrace half their prior movements). Although retracements do occur at the 23.60% line, these are less frequent and require close attention since they occur relatively quickly after the start of a reversal. In general, retracement lines can be considered stronger support and resistance levels when they coincide with a key moving average like a 50- or 200-day simple moving average.
Whenever applying Fibonacci retracements, keep in mind that retracement lines represent *potential *support and resistance levels – they represent price levels at which to be alert rather than hard buy and sell signals. It is important to use additional indicators, in particular MACD, to identify when support or resistance is actually being encountered and a reversal is likely. The more that additional indicators are pointing towards a reversal, the more likely one is to occur. Also note that failed reversals, especially at the 38.20% and 50% retracement levels, are common.
Indicator Comparison
Fibonacci retracements are somewhat similar to moving averages in that they can both be used to identify levels of support and resistance. However, the theories underlying these two indicators are entirely different. Fibonacci retracements are based on the mathematically-defined Fibonacci sequence and its ubiquity throughout nature, art, and science, whereas moving averages simply follow the price movements of a stock. As a result, Fibonacci retracements are fixed price levels following an initial price movement, whereas moving averages change over time as the price continues to fluctuate following the initial price movement and the following reversal. When Fibonacci retracement levels and moving averages coincide, the level of support or resistance is typically stronger.
Examples
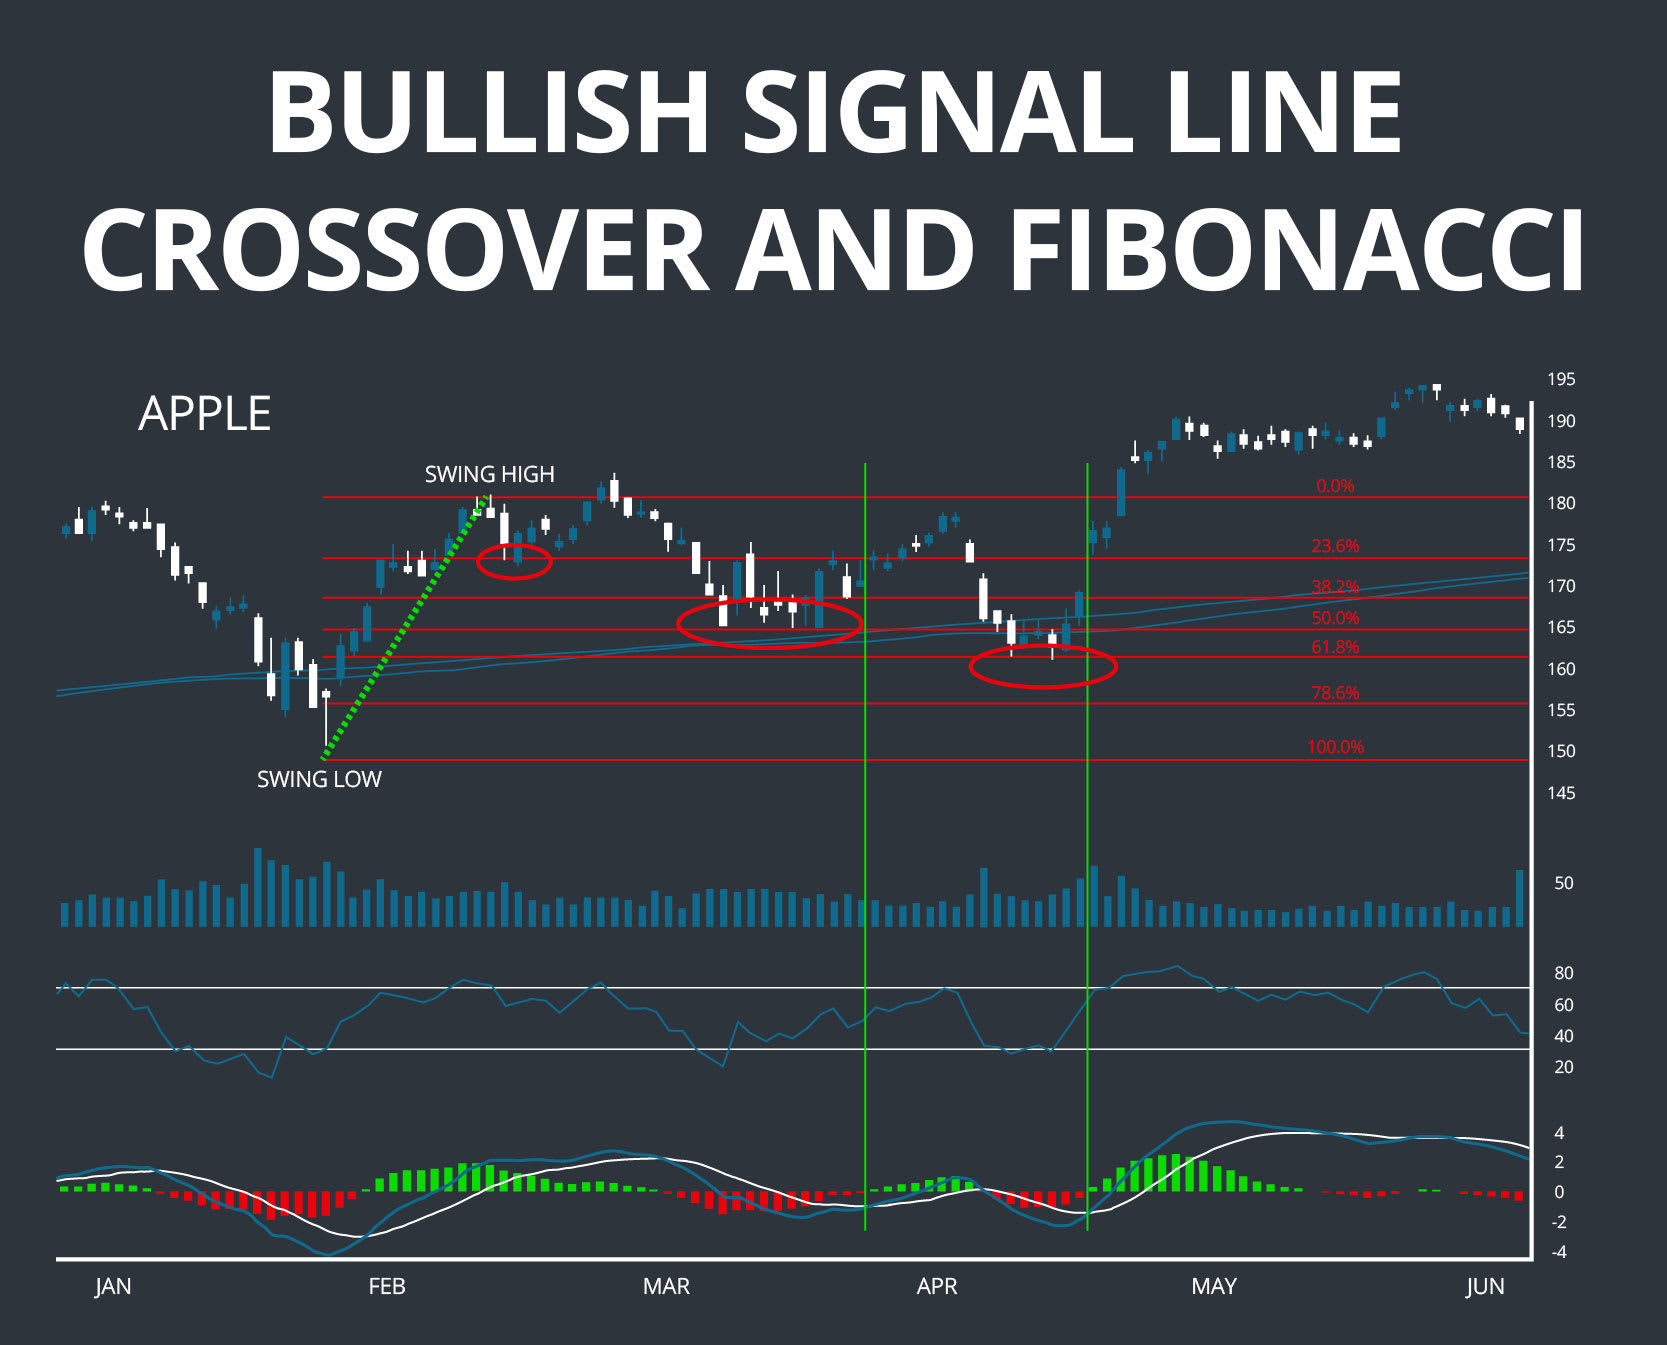
The first example shows how Fibonacci retracements can be used to identify multiple levels of support that can help predict the sawtooth pattern of an overall bullish movement. In this case, the stock price of Apple (AAPL) experiences an initial bounce at the 23.8% retracement level – a bounce that happened so quickly that it could not be predicted by MACD, and without this confirmation would be a risky trade for most traders. However, the 50% and 61.80% retracement levels later provide additional support after larger pullbacks, and reversals at both of these support levels could be confirmed by a bullish signal line crossover in the MACD.
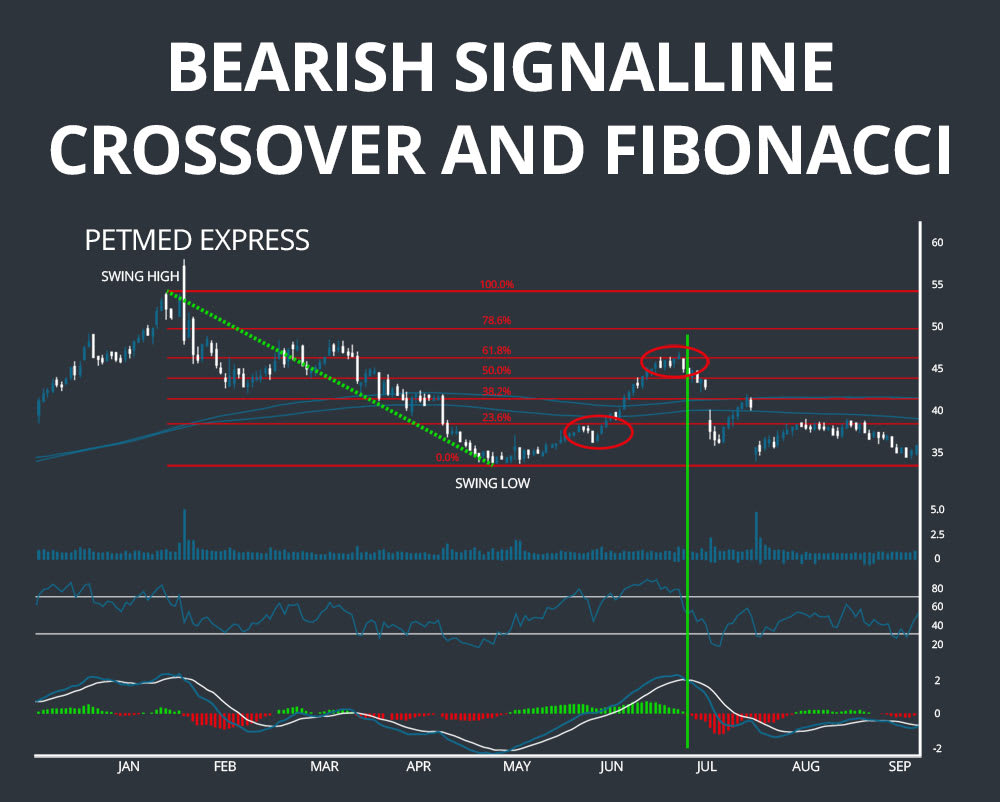
The second example demonstrates how Fibonacci retracements can be used to identify exit points when buying against an overall bearish trend. The chart of Petmed Express (PETS) shows a large bearish movement from January to May, at the end of which the stock price bounced significantly. For traders who had bought at the bottom – indicated by the bullish MACD signal line crossover and rise in RSI above 30 – selling at the top of the retracement is desired. While resistance is encountered at the 23.8% retracement level and supported by an RSI above 70, this reversal is not supported by the MACD and fails. Instead, a reversal at the 61.8% retracement level is supported by both an RSI above 70 and a bearish signal line crossover in the MACD – altogether providing a relatively strong indication for traders to exit their positions at this resistance level.
Get Started Now
Fibonacci retracements are commonly used by traders as an easy way to identify levels of support and resistance in trending stocks. Unlike moving averages, Fibonacci retracement levels are static and defined according to ratios found in the ubiquitous Fibonacci sequence. Whenever using Fibonacci retracements, retracement levels should be interpreted cautiously and always in conjunction with additional indicators like MACD to confirm a reversal.