What is a gap fill, and why do gap-ups fade?
A gap fill is a stock that opened above yesterday’s closing price trading back down to that close during the day. The gap is the empty space on the chart between yesterday’s last price and today’s first one; the fill is price going back through it. Traders who short a gap-up on the way down call it fading the gap, so “gap fade” is the trade and “gap fill” is the target.
The line is yesterday’s regular-session close, the 4:00 pm ET price, not yesterday’s high and not the last after-hours print. A stock that closed at $10.00, gapped to $10.80 and is trading at $10.20 has filled three quarters of its gap and has not filled it yet.
Why gap-ups give back ground, in the terms traders use:
- The pre-market is thin. The gap is set before 9:30, usually on a fraction of a normal day’s volume, by the people most excited about the stock. The opening auction is the first time the whole market prices it, and anyone who wanted to sell into strength has been waiting for it.
- Attention buying reverses. In the 3,000 largest US stocks from 1996 to 2008, stocks that drew attention earned more overnight and gave it back during the next trading day, about 13 basis points each way (Berkman, Koch, Tuttle and Zhang, 2012). That is an average across thousands of stocks, not a trade, but it is the effect a fader leans on.
- Trapped buyers. Everyone who bought above the open is losing money once the stock trades under it, and under VWAP the average buyer of the day is too. Their selling is what carries a failed gap toward yesterday’s close.
Size changes everything. On SPY since 1993, up-gaps of 0.1% to 0.25% filled the same day 78% of the time (1,213 gaps), and up-gaps of 1% to 2% only 26% of the time (291 gaps) (thetrading.tools). Single stocks that opened 20% or more above their prior close got back to it the same day 18.3% of the time, across about 3,000 gap days from December 2024 to November 2026 (TheDesperateTrader gap study). “Most gaps fill” is true of small gaps; a 30% gapper that fades usually stops well short of yesterday’s close. That is why the rules below trade gaps of 5% to 20% for the fill and treat bigger ones as their own trade.
How do you scan for gaps that are fading?
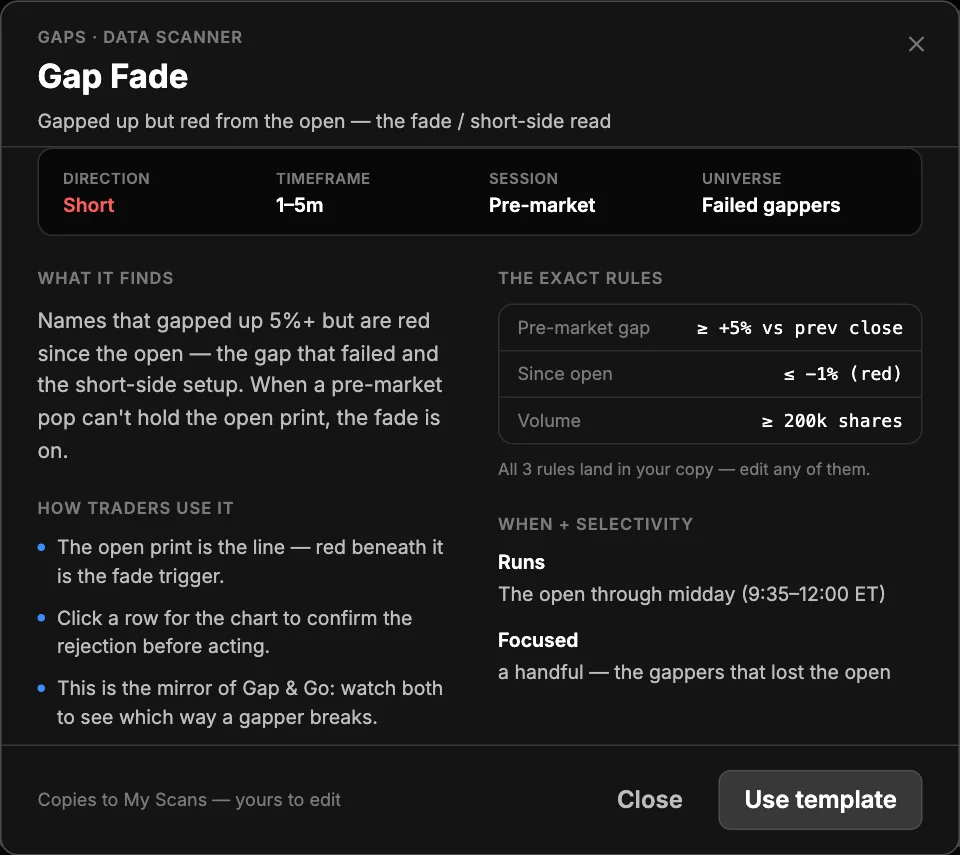
The scanner’s job is to show you, from the open, the gappers whose open has already failed, so you are watching three or four charts at 9:40 and not forty. Scanz’s Gap Fade template does that with three rules. In Discover, choose Data Scanner, open the Gaps tab, click Gap Fade and click Use template; your copy opens as Gap Fade (copy) and is saved in My Scans.
The scan · Data Scanner · Regular hours, from 9:30 ET (the gap rule reads the pre-market)
Gap Fade: the template as stored, and your copy
| Rule | Setting | Why it's there |
|---|---|---|
| Percent Change, Pre-Market (the gap) | Stored: ≥ 5. Your copy: the same | The stock's pre-market price is at least 5% above yesterday's close. The PM badge turns grey at 9:30 because the pre-market is over; from then on the rule holds the gap as the pre-market left it. |
| Percent Change, Regular Hours, compared to Session Open (shown RH[:SO]) | Stored: ≤ −1. Your copy: the same | Down 1% or more from today's open: the open did not hold. It is a regular-hours rule, so no stock passes it before 9:30. |
| Volume, Regular Hours | Stored: ≥ 200,000 shares. Your copy: ≥ 100,000 | Shares traded since the open, so a fade is real trading and not a few prints. At 200,000 a thinner gapper lists late: SKYA, below, reached it about ten minutes after it had already filled. |
| Last Price | Stored: none. Your copy: ≥ 2 | Thirteen of the 21 stocks the template listed at noon on November 20, 2026 were under $1, where a cent of spread is a large share of any stop and shares to borrow are hardest to find. |
7 days of Pro, card required.
When the scan starts listing. Two of the three rules are regular-hours rules, so the list is empty until 9:30, whatever the pre-market did. A gapper appears the moment it is 1% under its open with enough shares traded since 9:30: a heavily traded one within the first few minutes, a thin one later. The template’s card in Discover says it runs from the open through midday, 9:35 to 12:00 ET, and that is the window the rules below use. For the pre-market list of gappers before the bell, use the pre-market scanning guide.
What the grid shows, and the two columns to add. The template’s columns are Last Price, % Chg PM, Vol PM, Float, RVOL PM and News Count 4h. Last Price turns red once a stock trades under yesterday’s close, so a red price on this list is a filled gap. Add % Chg RH, the change from yesterday’s close, to see how much of the gap is left, and High PM, the pre-market high, which is the level a fade must stay under. News Count 4h counts headlines over the last four hours; click the row to read them before you short anything (QuickView guide).
The Activity Log under the grid records each stock as it enters the list, with the time (Scanner guide). Turn on Entered in its Event Type menu and give it a sound: a gapper entering this list is your cue to open its chart, not the trigger itself.
What are the entry, stop and exit rules?
This is the play most traders searching for a gap fill take: let the open fail, short the break of the opening range, and use yesterday’s close as the target. It is the version taught by most of the pages that rank for the term, with small differences in which level confirms the failure.
The setup on one card
- The gap
- Opened at least 5% and no more than 20% above yesterday's regular-session close, and on the Gap Fade list (1% or more under the open)
- Time window
- Triggers from the bar that closes at 9:40 to the bar that closes at 11:00 ET. The opening 5-minute bar, 9:30 to 9:35, is the opening range and never triggers.
- Trigger
- The first 5-minute bar that closes under the opening-range low and under VWAP, with the day's high still under the pre-market high
- Entry
- Short at the trigger bar's close, with a limit order at that price good for the next bar only. No fill, no trade.
- Stop
- A cent above the day's high so far (usually the opening-range high)
- First target
- Half off at 1R, the entry minus the entry-to-stop distance. Then move the stop on the rest to the entry.
- Final target
- Yesterday's regular-session close: the fill. Anything still open is covered at 12:00 ET.
- Skip it when
- The open was under 5% or over 20% above yesterday's close; the price is under $2; the stock has traded above its pre-market high; yesterday's close is less than 1R below the entry; the gap is on news that changes what the company is worth (earnings with a raised outlook, an approval, a buyout price); your broker has no shares to lend
Why each rule is there:
- 5% to 20%. Under 5% there is not enough room between the entry and the fill to pay for the risk. Over 20% the fill is the exception (18.3% of 20%-plus gappers in the study above): those stocks fade toward VWAP or a share of the move, not to yesterday’s close, and they have their own rules under Variations.
- The opening range, not the open. The first five minutes hold the opening auction and the widest spreads of the day. A stock 1% under its open at 9:32 has not failed yet; one that closes a 5-minute bar under the opening bar’s low has shown that buyers could not defend it.
- Under VWAP. Below VWAP, the average share bought today is losing money. A close under the opening-range low that is still above VWAP usually means the opening bar was a wide spike, and the stock is still being bought.
- Under the pre-market high. A gapper that takes out its pre-market high is doing what a gap-and-go trader is waiting for. That stock belongs to the gap and go page, not this one.
- The stop above the high. The trade says the high of the day is in. If price takes it out, the thesis is wrong, whatever happens later.
- At least 1R to the fill. A stock with a wide opening range can trigger with yesterday’s close closer than the stop. CAPR, below, is the example: the card skipped it, and it filled anyway. The tighter stop under Variations is the version that takes those.
- The news check. A gap on a fresh, material catalyst is where the gap-and-go traders are; the gaps that fill most readily are on stale, recycled or soft news. The news trading guide covers which headlines a fader waits for.
What Scanz cannot tell you. Whether your broker can lend you the shares, or what it charges: Scanz has no borrow-fee, hard-to-borrow or locate data. Check the locate before 9:30 on anything on your watchlist, because the stocks that fade hardest are often the ones with nothing to borrow.
A real session: the Gap Fade list on November 20, 2026
November 20 was a down day: SPY opened at 713.56 against a 715.87 close and traded near 701.6 at noon, about 2% lower. Weak markets help fades, so read the results below with that in mind. The Gap Fade template, opened from Discover at 11:59:19 ET, listed 21 stocks.
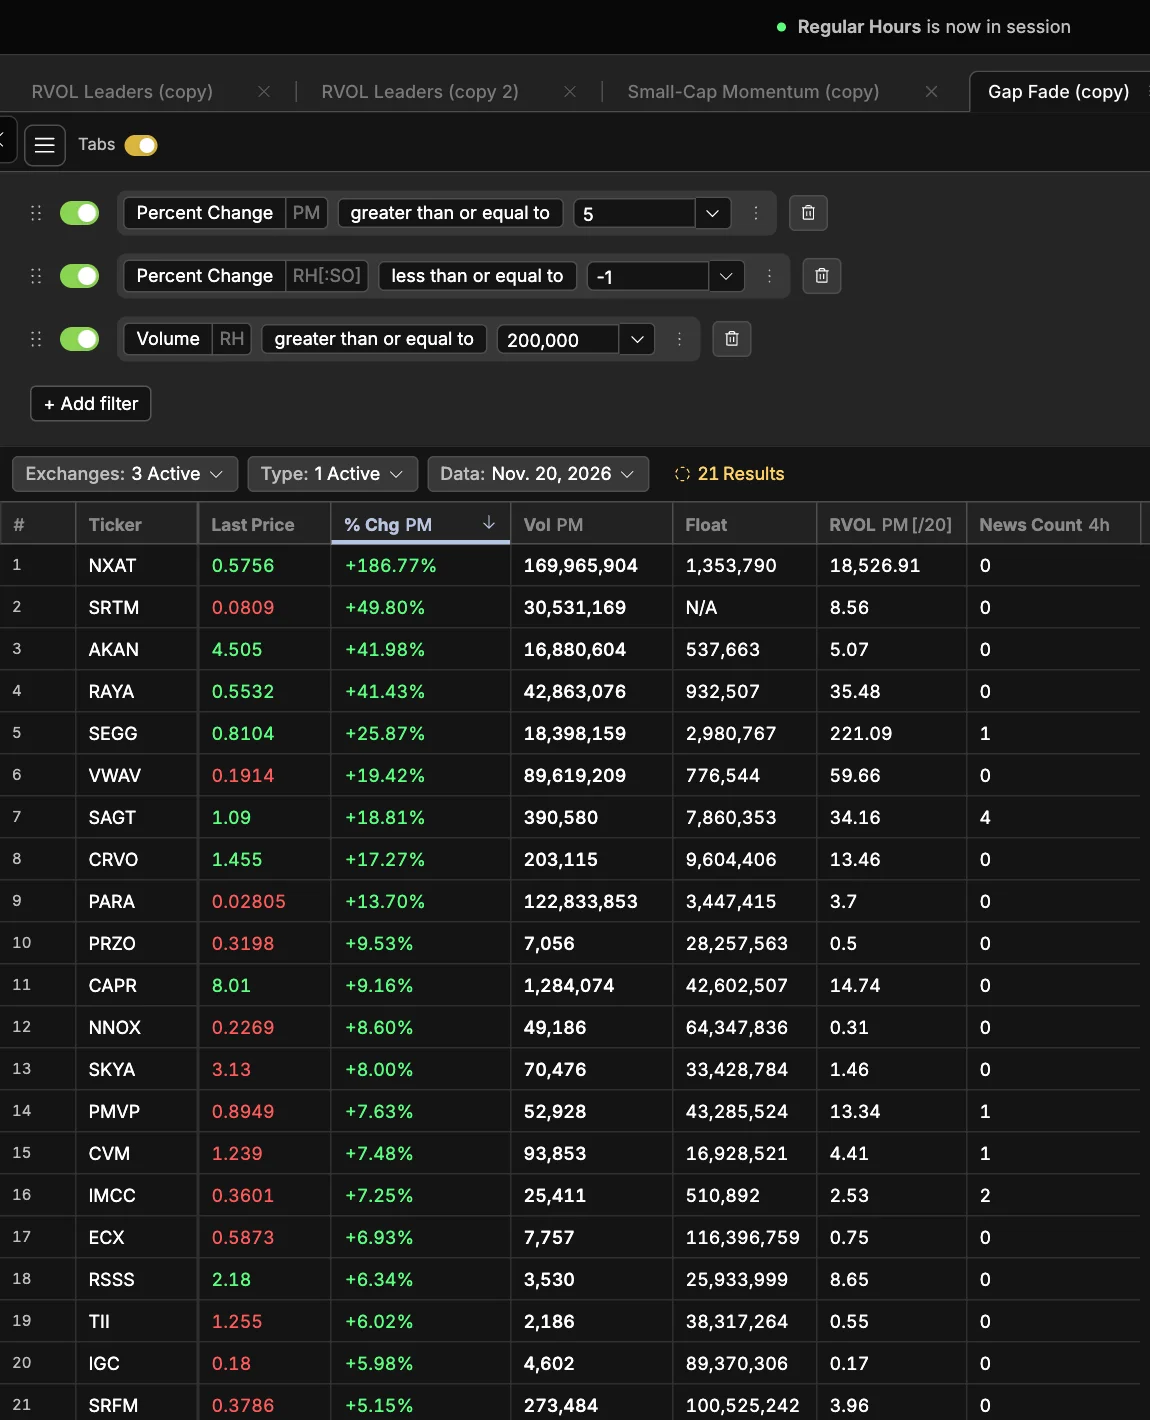
Where the numbers come from. The lists, their columns and the High PM values are Scanz captures from 11:59 ET. The bar-by-bar prices, VWAP and volume counts below are public 1-minute consolidated data (Yahoo Finance), with VWAP computed from it; Scanz charts were not captured for these stocks. The two sources count pre-market prints differently, so a pre-market figure can differ by a few tenths of a percent.
CAPR: the fill the card skipped
| Time (ET) | What happened |
|---|---|
| Pre-market | Closed at $7.53 on November 19. Ran to $8.94 by 8:05 am, then drifted back. Scanz: % Chg PM +9.16% on 1,284,074 pre-market shares, no headline in the last four hours by noon. |
| 9:30 to 9:35 | Opened at $8.16, 8.4% over yesterday’s close. The opening bar’s high was $8.34, well under the pre-market high; its low, the opening-range low, $7.92. About 1.6 million shares, so the volume rule was met inside the first minute. |
| 9:35 to 9:40 | Fell through $8.08, 1% under the open, and joined the list. The bar closed at $7.85: under the opening-range low and under VWAP at about $8.08. Trigger. |
| The card’s math | Short $7.85, stop $8.35 (a cent above the $8.34 high): $0.50 of risk. Yesterday’s close was $0.32 away, 0.64R. Skip: less than 1R to the fill. |
| 9:50 | Traded $7.51, through yesterday’s $7.53. The gap filled 20 minutes after the open. |
| 11:05 | Back to $8.16, the open. At 11:59 it was $8.01, still on the list. |
The skip cost a winner, and it is the right call by the card: a $0.50 stop for $0.32 of target only pays if the fill comes more than six times in ten. The tighter stop under Variations took it: short $7.85, stop $8.07 above the trigger bar, half off at 1R ($7.63) at 9:49 and the rest at $7.53 at 9:50, for +1.22R.
SKYA: the card’s trade, and the volume rule’s lag
| Time (ET) | What happened |
|---|---|
| Pre-market | Closed at $4.00. Scanz: % Chg PM +8.00% on only 70,476 pre-market shares. Pre-market high $4.36. |
| 9:30 to 9:35 | Opened at $4.31, 7.7% over yesterday’s close. Opening range $4.183 to $4.33, 109,636 shares, most of it the opening print. |
| 9:35 to 9:40 | Closed at $4.17, under the $4.183 opening-range low and under VWAP at about $4.27. Trigger. |
| The card’s math | Short $4.17, stop $4.34: $0.17 of risk. Yesterday’s close $0.17 away: 1.0R, just enough. Taken. |
| 9:45 | Traded $3.97. 1R and the fill are the same price here, $4.00, so the whole position came off at $4.00: +1.0R. |
| After | Kept falling to $3.27 by 10:40, 24% under its open. $3.13 and red on the noon list. |
With the template’s 200,000-share rule, SKYA could not reach the list before about 9:55 by the public volume count, ten minutes after the fill: it traded under 10,000 shares in most minutes after the open. That is why your copy uses 100,000, which SKYA passed in its opening bar. The thin tape cuts both ways: a short in a stock trading a few thousand shares a minute can be hard to cover at your price.
AKAN: the 42% gapper the scan could not call
AKAN gapped 41.98% pre-market on 16.9 million shares, with a float Scanz shows as 537,663 shares. It opened at $4.86, pushed to $5.54 at 9:40, under its $5.60 pre-market high, and then dropped to $4.16 by 9:58. The public 1-minute record then has no trades until 10:18, and again from 10:52 to 11:02, the pattern trading halts leave (Scanz has no halt data, and we did not confirm them at the exchange). It reopened at 10:18 at $3.35, under yesterday’s $3.43 close: filled, 31% under the open. Thirty minutes later it was at $5.60, 15% above its open and off the Gap Fade list, and at noon it was back on it at $4.505.
The card did not trade AKAN: the open was 41.7% over yesterday’s close, outside the 5% to 20% rule. A short at 9:45 under the opening range with a stop above the high would have risked 20% of the price, sat through a halt, and seen the stock go from the fill to the stop inside an hour. This is the clearest thing the scan cannot see: it lists a gapper that is red from its open, and it cannot tell a fade that will keep going from one about to reverse.
SSPC: the card’s loss
SSPC was not on the noon list, and that is the point: it had been on it at 9:55 and was gone by 10:10. It turns up in the other gap template captured at the same minute, True Gap 5%+, which lists every stock that opened 5% or more above yesterday’s close; it showed SSPC at $9.82, up 13.00%, with a pre-market high of $9.98.
| Time (ET) | What happened |
|---|---|
| Pre-market | Closed at $8.69. Pre-market high $9.98. |
| 9:30 to 9:35 | Opened at $9.52, 9.6% over yesterday’s close, on about 3 million shares. Opening range $9.40 to $9.77. |
| 9:35 to 9:55 | Drifted under its open: down 1% by 9:50, onto the Gap Fade list. |
| 9:55 to 10:00 | Closed at $9.30, under the $9.40 opening-range low and under VWAP at about $9.50. Trigger. |
| The card’s math | Short $9.30, stop $9.79 (a cent above the $9.78 high): $0.49 of risk. Yesterday’s close $0.61 away: 1.24R. Taken. |
| 10:00 to 10:24 | Low of $9.24, never near 1R ($8.81). Back over VWAP and the open at 10:10, through $9.79 at 10:24. Stopped: −1.0R. The tight stop, $9.46, went at 10:08, also −1.0R. |
| After | $9.82 at noon, up 13% on the day. |
SSPC is a leveraged inverse ETF, built to move twice as far as the stock it tracks in the opposite direction. Its gap was the mirror of an overnight drop in that stock, not news about SSPC, and nothing about it had to fill. The card has no rule for that, and this page does not add one after the fact. It is a reason to know what you are shorting before 9:30.
Every 5% to 20% gapper over $2, and what the card did
The two captures between them list every stock over $2 that opened 5% to 20% above yesterday’s close with volume behind it. The card is applied to all of them, wins and losses alike; “High PM” is the pre-market high as Scanz shows it.
| Stock | Open vs yesterday’s close | Card | Outcome |
|---|---|---|---|
| SKYA | +7.7% | Short $4.17, stop $4.34 | Filled at 9:45: +1.0R. Tight stop +1.5R |
| SSPC | +9.6% | Short $9.30, stop $9.79 | Stopped at 10:24: −1.0R. Tight stop −1.0R |
| CAPR | +8.4% | Skip: 0.64R to the fill | Filled at 9:50. Tight stop +1.22R |
| RSSS | +6.8% | Skip: the opening bar traded $2.22, over the $2.18 High PM | Its pre-market gap was 3,530 shares |
| GAP | +7.8% | Skip: over the $20.49 High PM in the opening bar | Held the open; up 12.8% at noon |
| GLOB | +8.7% | Skip: opened over the $42.00 High PM | Up 2.4% at noon |
| ESE | +7.3% | Skip: opened over the $235.00 High PM | Filled; down 1.5% at noon |
| BGS | +6.8% | Skip: over the $3.59 High PM in the opening bar | Up 8.9% at noon |
| BKE | +5.2% | Skip: over the $43.36 High PM in the opening bar | Up 6.9% at noon |
| AKAN | +41.7% | Skip: over 20% | Filled at 10:18 after a halt gap, then back above the open |
Two trades, one win and one loss, net 0R; the tight stop took three, +1.72R. Five skips were stocks that traded through their pre-market high. Four of them held their gap, the gap and go side of the same morning, and the pre-market-high rule kept the card out of all four; the fifth, ESE, filled anyway. One session, on a day SPY fell 2%, is an illustration, not a record.
How does the trade change with the gap size, the stop or the direction?
A tighter stop: above the trigger bar
Some traders put the stop a cent above the high of the trigger bar instead of the day’s high. It takes trades like CAPR, where the opening range is wide, and it gets stopped more often, because a bounce of one bar’s height is enough. On November 20 it took both CAPR (+1.22R) and SKYA (+1.5R); on a day when gappers bounce back to their open before failing, it gives back those wins one stop at a time. Use it with the same entry, targets and skips, and never move the stop up once the trade is on.
Gaps over 20%: wait for the first push to fail
Small caps that gap 30% to 100% or more rarely fill. Traders who short them, such as Steven Dux’s small-cap short framework described in TradeZella’s write-up, do not short the opening range. They wait for the opening push to make a high that cannot be beaten, let the stock base for 30 to 60 minutes, and short the break of that base after 10:00, with the stop above the base or the high, aiming for a share of the move (the write-up gives an average fade of about 26% from the high) rather than yesterday’s close. AKAN shows why: the first push ran to $5.54 and the move after the halt ran to $5.60, and either would have stopped an early short. This page does not measure that version.
Fading a gap down
The mirror trade buys a stock that gapped down and fails to keep falling, with yesterday’s close above as the target. Make a second copy of the template with Percent Change, Pre-Market at −5 or lower and Percent Change compared to Session Open at +1 or higher, and use the rules upside down: the trigger is a 5-minute close over the opening-range high and over VWAP, the stop a cent under the day’s low. Pro saves both copies; Starter keeps one Data scan. Gap-downs on bad news that changes the company’s value (a failed trial, a guidance cut) are the ones to leave alone.
Index and ETF gaps
On SPY and index futures, small gaps fill most days, and many traders fade them mechanically at the open with no trigger at all. The SPY numbers above show the edge disappears as the gap grows past about half a percent. Scanz scans US stocks and ETFs, not futures; the template’s 5% floor will rarely list an index ETF.
Why do gap fades fail, and what can’t the scan see?
- The fade reverses. The scan lists a stock that is red from its open. It cannot tell you whether that stock will keep falling or squeeze back above the open; AKAN did both in an hour. The trigger, the VWAP rule and the stop are there because the list alone is not a reason to short.
- The gap is real news. An earnings beat with a raised outlook, an FDA approval or a buyout at a fixed price can dip at the open and then trend up all day. Read the headline before the chart.
- A crowded short squeezes. Heavily shorted stocks that gap up can run when the early shorts cover. The short squeeze guide covers the short-interest filters Scanz does have.
- Halts. A halted stock can reopen far through your stop. Scanz has no halt data; low-priced, low-float gappers are the ones that halt most.
- Borrow and the uptick rule. Your broker may have no shares to lend, and Scanz cannot show it. Once a stock falls 10% from yesterday’s close, the SEC’s short-sale rule (Rule 201) allows new shorts only above the best bid for the rest of that day and the next, which matters for gap-down fades and for adding to a short below yesterday’s close.
- The list is late on thin names. At 200,000 shares the template lists thin gappers after the move, as SKYA showed; at 100,000 it lists more stocks you cannot trade size in.
- Time. Fades that have not reached the fill by late morning often stall. That is why the card covers at 12:00 ET, the end of the template’s own window.
The checklist before you short the gap
Before the short
- Did it open at least 5% and no more than 20% above yesterday's close, and is it 1% or more under its open?
- Is the price $2 or more?
- Is it after the opening 5-minute bar and before 11:00 ET?
- Has a 5-minute bar closed under the opening-range low and under VWAP?
- Has the day's high stayed under the pre-market high?
- Is yesterday's close at least 1R below the entry, with the stop a cent above the day's high?
- Have you read the headline, and is it not news that changes what the company is worth?
- Does your broker have shares for you to borrow, at a fee you accept?
- Do you know where half comes off (1R), where the rest comes off (yesterday's close) and when you are out (12:00 ET)?
Questions traders ask
What does it mean when a gap fills?
A gap fills when a stock that opened above (or below) yesterday's close trades back to that close. For a gap-up, the fill is the first trade at or under yesterday's 4:00 pm ET close. A gap can fill the same day, days later, or never.
Is gap fade the same as gap fill?
They describe the same trade from two sides. Fading the gap is the action, trading against the direction of the gap, usually shorting a gap-up; the fill is what the fader is aiming for. Plenty of fades are covered before the fill, because many gaps only fill part of the way.
Do all gaps fill?
No. Small gaps fill most of the time: on SPY since 1993, up-gaps of 0.1% to 0.25% filled the same day 78% of the time. Big ones mostly do not: in one study of stocks that opened 20% or more higher, 18.3% got back to the prior close that day. The rules on this page use the fill as the target only for gaps of 5% to 20%.
When do gaps usually fill?
When a gap-up fails, it usually shows in the first hour: the stock cannot get past its pre-market high and breaks its opening range. On November 20, 2026, CAPR filled 20 minutes after the open and SKYA 15 minutes after. Fades that have not filled by late morning often stall, which is why the rules cover anything left at 12:00 ET.
What is the best time frame for a gap fill trade?
The 5-minute chart for the trigger, because the opening range is the first 5-minute bar and a close under it filters out the opening noise. Many traders watch the 1-minute chart to manage the exit.
Can you scan for gap fills before the market opens?
You can scan for gappers before the open, but not for fades: a gap has not failed until regular trading shows it. The Gap Fade template's change-from-open and volume rules are regular-hours rules, so it lists nothing before 9:30. Build the pre-market watchlist with a gapper scan and let Gap Fade take over at the bell.
Should you short a gap up at the open?
Shorting the opening print is the mechanical version index traders use on small gaps. On stocks gapping 5% or more, most traders wait for the open to fail, because the first minutes decide whether it is a gap and go or a fade. The cost of waiting is a worse price; the gain is not shorting the gappers that run.
What stop do traders use on a gap fade?
Above the high of the day, usually the opening-range high, because the trade assumes the high is in. A tighter version uses the trigger bar's high. Either way, check that yesterday's close is at least as far below the entry as the stop is above it.