Momentum trading is a popular strategy in which traders seek to buy winning stocks and sell them when they begin to run out of steam.
The key to any successful momentum trading strategy is finding stocks that have plenty of upside left in them and recognizing. In this article, we’ll show you two ways you can build a momentum stock screener and find momentum stocks using Scanz.
What is a Momentum Stock?
A momentum stock is any stock that is in the middle of a strong bullish or bearish trend. Typically, a momentum stock has seen its price rise steadily up (or down) for a prolonged period with relatively little interruption.
When trading momentum stocks, it’s important to keep in mind that momentum always comes to an end eventually. The goal behind momentum investing is to buy when momentum is strong and sell when it starts to fade. That way, you can avoid holding the stock if and when a reversal occurs.
Factors to Consider Before Searching for Momentum Stocks
Before you start your search for momentum stocks, you’ll need to make a few decisions about what types of momentum stocks you want to look for.
First, consider your timeframe. Stocks can have momentum for a few hours – which is good for day trading – or for days or weeks at a time – good for swing trading. Medium-term investors can even find stocks with momentum that stretches on for 12 months or longer.
Another thing to consider is how much volatility you’re willing to tolerate. Momentum stocks can gain ground in a nearly straight line with no intermittent drops. Alternatively, they can establish a strong trend with large price deviations above and below the trendline. How volatile a momentum stock is will directly impact your trading risk.
Finally, it’s a good idea to think about what parts of the market are experiencing momentum broadly. For example, a specific market sector may be experiencing momentum, which bodes well for finding individual momentum stocks within that sector. At times, different market capitalization groups can experience momentum, too. Small-cap stocks, for example, might be steadily rising while large-cap stocks are wavering.
Why Use a Momentum Stock Scanner?
Creating a stock scanner is not only the easiest way to find momentum stocks, but also one of the most effective methods. That’s because the list of stocks that are experiencing momentum can change on a day-to-day basis. Volatility can rise or fall, news can amplify or derail trends, and reversals can happen with little warning.
So, it’s important when searching for momentum stocks to scan frequently. If you have trades open, running a momentum screen can also alert you to when stocks fall below your threshold for strong momentum.
How to Find Momentum Stocks in Scanz
There are two ways to find momentum stocks in Scanz: with the Easy Scanner and with the Pro Scanner. We’ll show you how to use both tools and offer some example screens.
Easy Scanner
The Easy Scanner is the best place to start if you’re just beginning a new search for momentum stocks. To get started, add filters for % Change and Current Trades to limit your scan to stocks experiencing high trading activity:

Then you can sort the results by the % Change or Trades columns to find see what stocks are seeing the most volatility and trading interest for the current day.
Pro Scanner
For more precise control over your momentum screen, you can use the Pro Scanner. With the Pro Scanner, it’s easy to filter stocks by percent change or relative volume. For example:
PERCENT CHANGE is greater than VALUE 5
AND
DAY’S VOLUME is greater than ANALYTIC 10 DAY AVG VOLUME

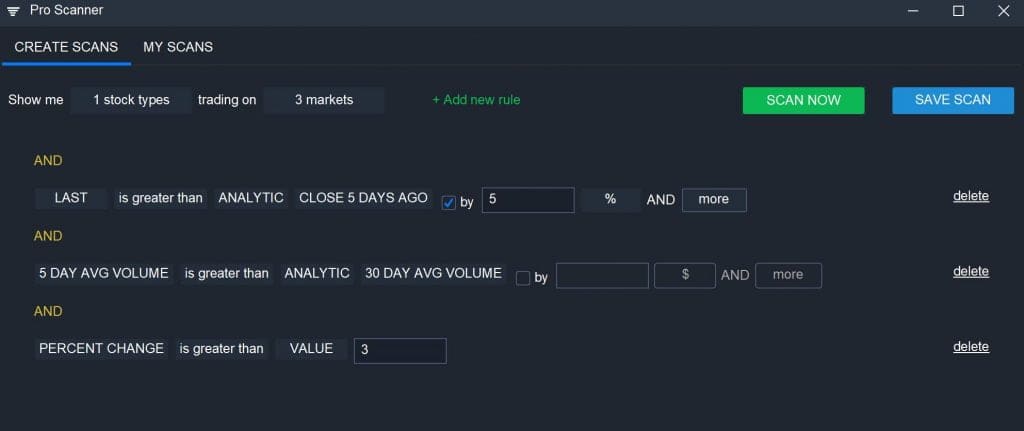
You can also screen for stocks that are experiencing momentum on a weekly timeframe by looking for stocks that have risen sharply over the past 5 days. In this case, it’s also a good idea to check that trading volume has been relatively high over the same timeframe and that the stock is continuing to move upward:
LAST is greater than ANALYTIC CLOSE 5 DAYS AGO by 5% AND More
AND
5 DAY AVG VOLUME is greater than ANALYTIC 30 DAY AVG VOLUME
AND
PERCENT CHANGE is greater than VALUE 3
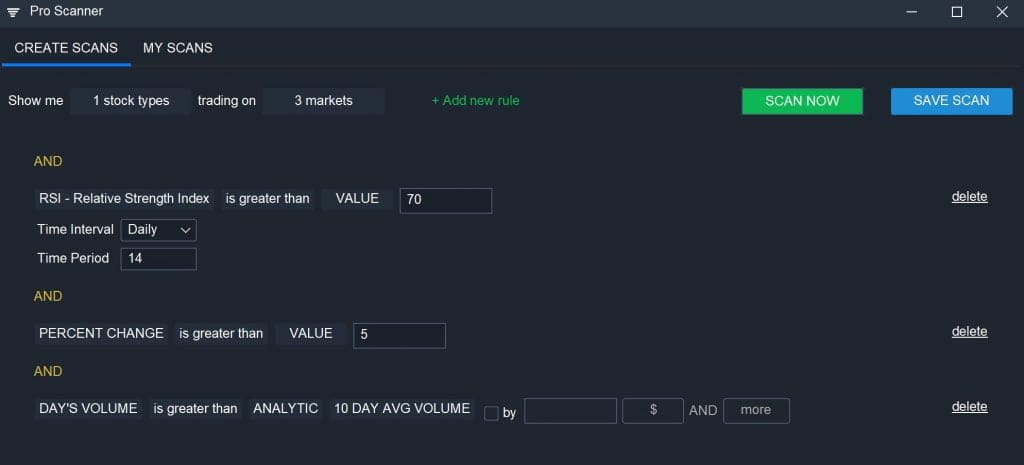
You can also bring technical indicators like MACD and RSI into your momentum scan when using the Pro Scanner. For example, many momentum stocks have an RSI above 70 because of their rapid price appreciation. So, you can create a screen using RSI, percent change, and trading volume:
RSI (Daily, 14) is greater than VALUE 70
AND
PERCENT CHANGE is greater than VALUE 5
AND
DAY’S VOLUME is greater than ANALYTIC 10 DAY AVG VOLUME
Conclusion
A big part of the challenge in momentum trading is simply finding stocks with strong momentum. With the Easy and Pro Scanners in Scanz, you can quickly screen for stocks experiencing above-average volatility and trading interest. Plus, with the Pro Scanner, you can easily scan for momentum stocks based on technical indicators like RSI.
Related Reading:
- Best Scans for Momentum Traders
- How to Find the Hottest Stocks in Any Sector
- How to Find Breakout Stocks Using The Pro Scanner
- 8 Tips for Building Better Stock Scanners
- Customize Your Scanz Setup for Momentum Trading
Ready to start scanning? Try for free and choose the plan that fits your workflow.