Small cap stocks often have higher growth potential and more volatility than large cap stocks. While these stocks can be somewhat risky, they also offer plenty of opportunities for trading.
In this guide, we’ll explain what to look for when trading small cap stocks and show you how to find small cap stocks using Scanz.
What is a Small Cap Stock?
A small cap stock is any stock with a market cap between $250 million and $2 billion. Stocks with a market cap under $250 million are typically referred to as micro-cap stocks.
Small cap stocks can also be penny stocks – stocks with a share price less than $5 – but that’s not necessarily the case. Many small caps have a higher share price, but only a limited number of shares available.
What Types of Small Cap Stocks Should You Trade?
There are thousands of small cap stocks across the NASDAQ exchange and OTC markets, so you need to be specific in defining what types of small cap stocks you want to trade.
The best place to start is to determine what your goal is. Are you looking for a long-term investment in a promising young company? Or are you interested in short-term trading around a specific technical setup? Defining your intention ahead of time is key to finding small cap stocks that are right for you.
If your goal is to trade small caps because of their high volatility, the next thing to consider is what type of setups you want to trade. For example, you could look for small cap stocks with bullish momentum or stocks that are poised for a breakout.
It’s also important to think about your timeframe. Trading intraday patterns will require different search criteria than swing trading small cap stocks over several days or weeks.
How to Find Small Cap Stocks with the Pro Scanner
Once you know what types of small cap stocks you want to trade, you can find them using the Pro Scanner in Scanz.
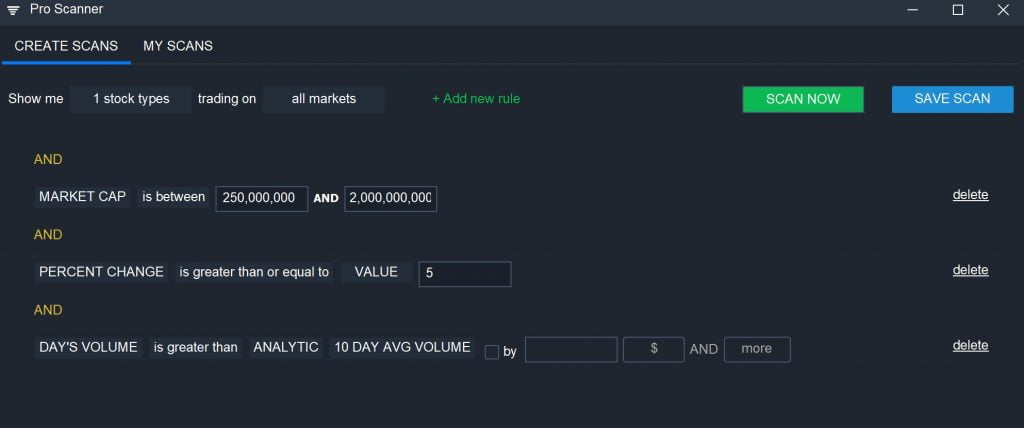
To start, create a filter to limit your search to small cap stocks:
MARKET CAP is between 250,000,000 AND 2,000,000,000

You can also add a price filter to search for only shares that cost more than $5 if you want to eliminate penny stocks from your scan.
Next, add additional parameters that make sense for your setup. You might add a percent change filter, for example, to find only small caps that are experiencing big price movements today. Or you can use a relative volume screen to find small caps that are seeing a lot of interest from traders.
PERCENT CHANGE is greater than or equal to VALUE 5
AND
DAY’S VOLUME is greater than ANALYTIC 10 DAY AVG VOLUME
Example: Small Cap Breakouts
Let’s look at how you can use the Pro Scanner to look for a common small cap setup: a breakout above the 52-week high. For this scan, you’ll want to look for small cap stocks that are experiencing a big price movement on strong volume and that are now priced above their 52-week high:
MARKET CAP is between 250,000,000 AND 2,000,000,000
AND
PERCENT CHANGE is greater than or equal to VALUE 5
AND
DAY’S VOLUME is greater than ANALYTIC 10 DAY AVG VOLUME
AND
LAST is greater than 52 WEEK HIGH
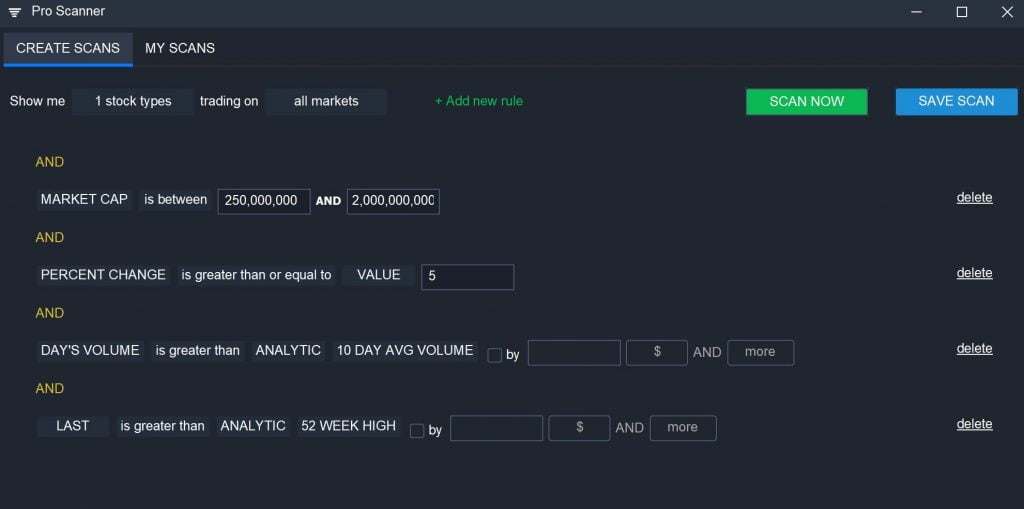
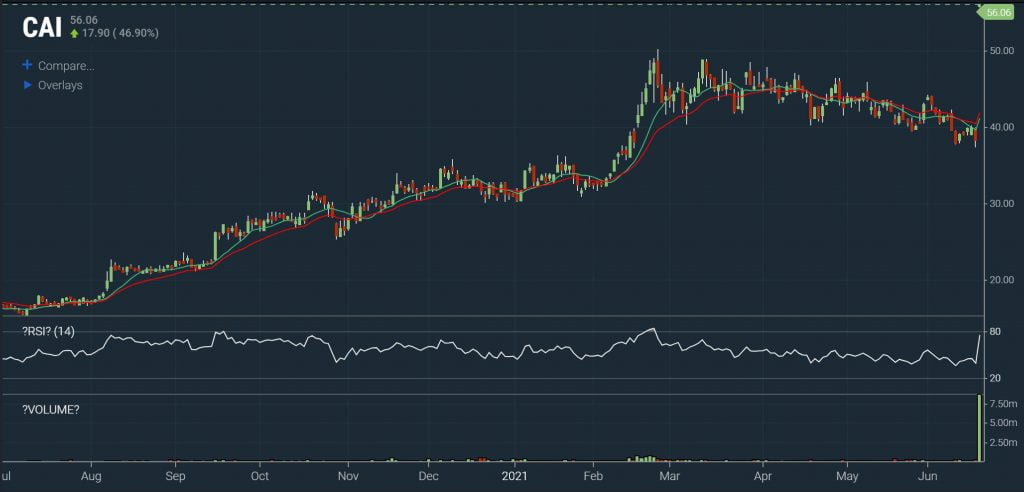
You can also find small cap breakdowns using a similar scan. Just change the price parameter to filter for stocks with a last price that is less than the 52-week low.
Example: Small Cap Volume Leaders
Another useful small cap scan can help you find small cap stocks that have higher than usual trading volume. Abnormally high trading volume is often accompanied by volatility and the higher liquidity makes it easier to get in and out of trades quickly.
To find small cap volume leaders, you can use two volume filters:
MARKET CAP is between 250,000,000 AND 2,000,000,000
AND
DAY’S VOLUME is greater than ANALYTIC 10 DAY AVG VOLUME by 10% AND More
AND
$VOLUME is greater than VALUE 100,000,000
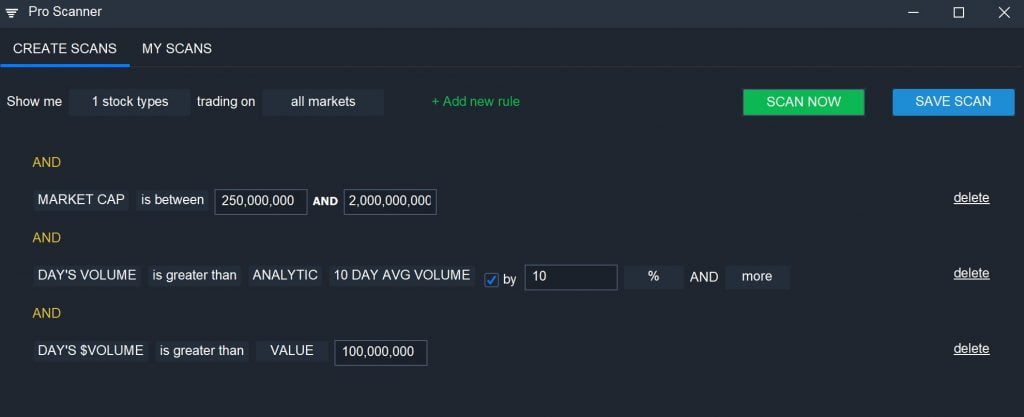
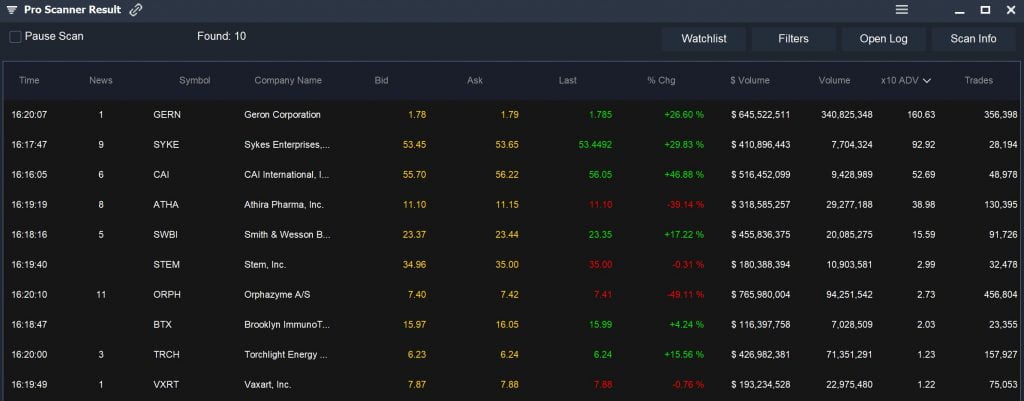
These filters can be easily adjusted to suit your goals and you can sort the scan results based on volume.
Conclusion
Small cap stocks offer high volatility and lots of growth potential compared to large cap stocks. With the Scanz Pro Scanner, it’s easy to find small cap stocks that fit your target setup for trading.

