What are market internals?
Market internals give us a peek “under the hood” of the market, if you will. From them we gleam insights into the market’s breadth. The S&P may be up on the day, but the market internals may tell a different story. It may be one sector driving the rally, while the majority of stocks are weak on the day.
Market internals are indexes using data derived from stock exchanges like the NYSE or NASDAQ, like the amount of NYSE stocks upticking vs. downticking on a minute to minute basis, or the amount of the stocks advancing in volume, vs. declining in volume, on a minute to minute basis. These internals can often serve as leading indicators, as you can see what the internals of the market’s engine are doing in real-time.
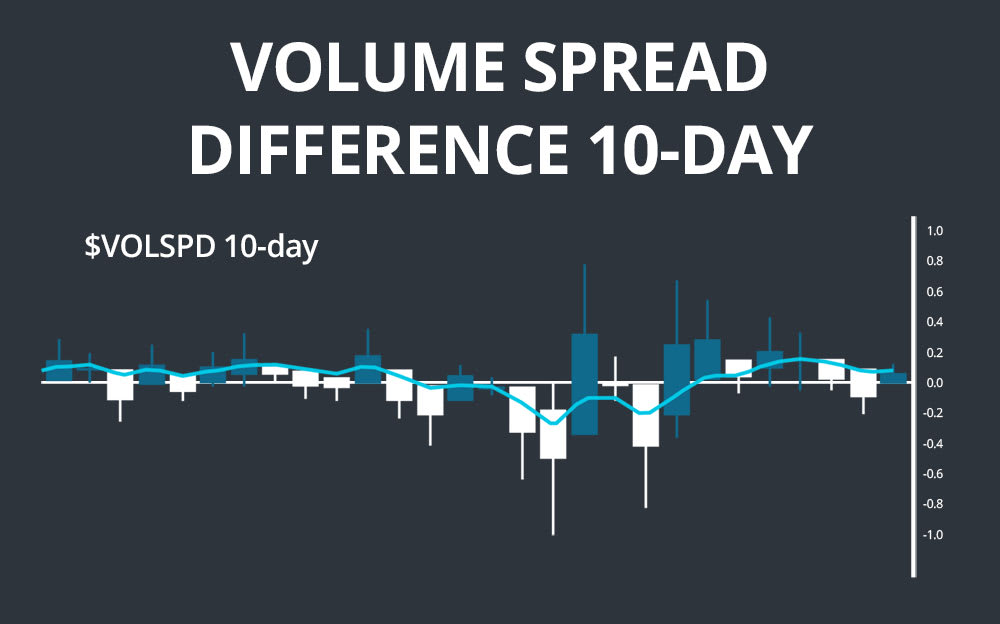
Volume Spread Difference - $VOLSPD or $UVOL-$DVOL
The Volume Spread Index shows the difference between volume on stocks advancing for the day, and volume on stocks declining for the day. This index is essentially made up of two tickers, $UVOL and $DVOL. On some charting platforms, like Thinkorswim, you can simply type “$UVOL-$DVOL” in the ticker box and get this index, while other platforms have their own ticker for it, like $VOLSPD.
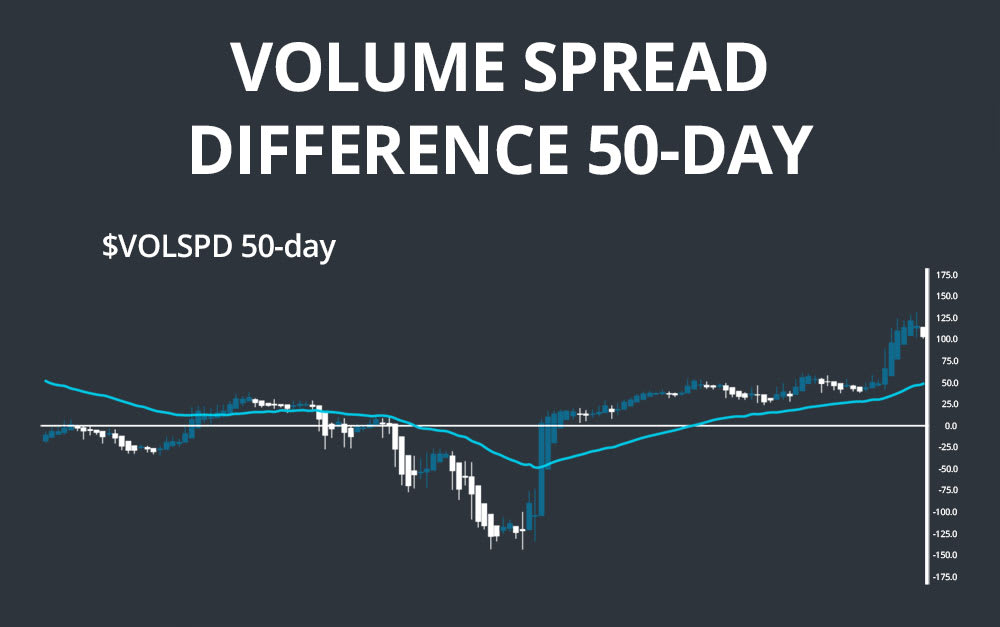
This index is most useful on two time frames: a daily chart to see the trend of the last few days, and a short term intraday chart to see where the volume is moving in the next hour.
On the daily chart it is useful to plot a shorter term moving average, like a 10-day, and a zero line. If the moving average is above the zero line, more volume has generally been going into the advancing stocks over the last few days, signalling strength from the bulls.
On the intraday chart, a longer term moving average, like a 50-period, has more application as it gives you a perspective on the broad trend for the day.
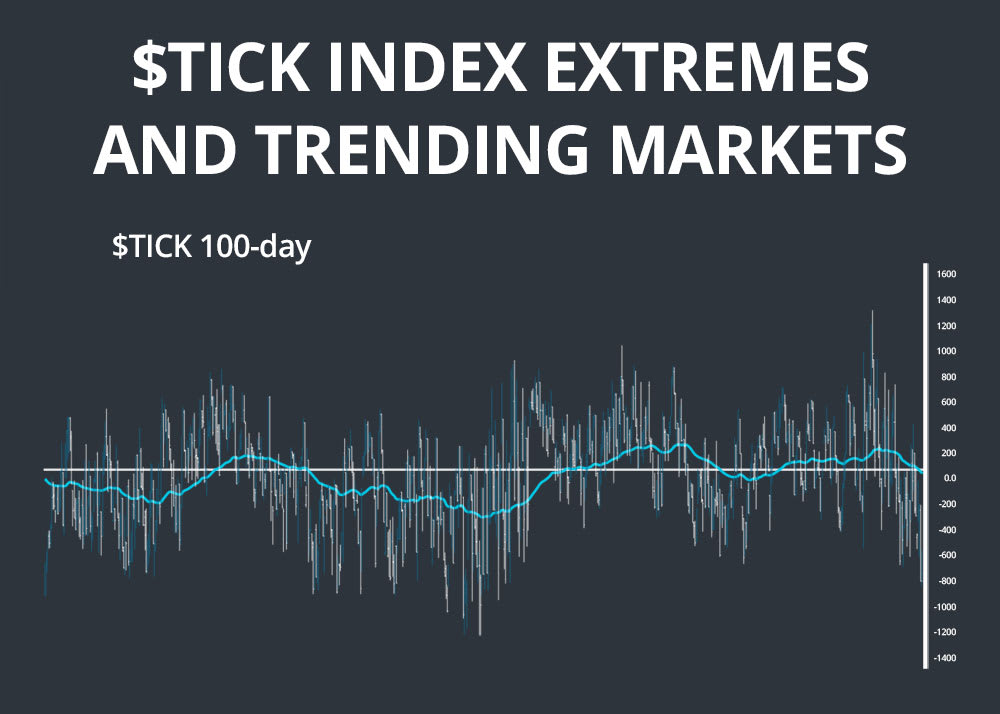
NYSE TICK - $TICK
The NYSE $TICK Index only has application on a very short time frame. It is the ultimate pulse of the market on a second-to-second basis. Concisely, the $TICK measures on many stocks on the NYSE in that moment are upticking vs. downticking.
The $TICK’s reading are quoted in negative or positive numbers. For example, a reading of +400 means that in the last 6 seconds, 400 more stocks upticked than downticked on the NYSE.
Generally, the use of the $TICK index is to identify extremes in markets and fade them. Be careful though, in a strong trending market, trying to fade extremes is like trying to catch a falling knife. However, in a choppy market climate, fading extremes can be a very profitable strategy.
Another strategy used by some day traders is to use $TICK in strong trending markets. When they’ve identified a trending day, they will use high $TICK readings as a confirmation indicator, rather than trade divergences.
As more issues get added to the NYSE, the extreme readings change. At the time of writing, here are some extreme levels to take note of:
- 800
- 1000
- 1400
In the choppiest markets, 800 is an extreme reading, while in more volatile and trending markets, you’re better off using 1400 as a reference point. It helps to plot lines at the extreme levels to filter out a lot of noise.
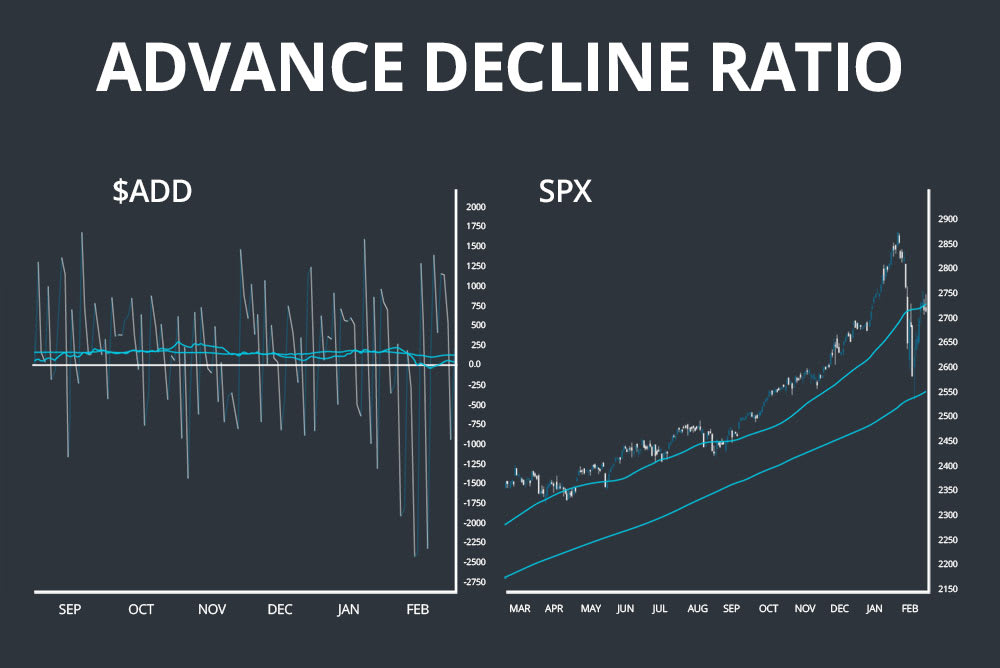
Advance-Decline Difference - $ADD
The Advance Decline Ratio is the difference between advancing and declining stocks. Like the other internals mentioned earlier, this index also gives negative and positive readings. A reading of -400 means that 400 more stocks went down on the day than advanced on the day.
The main use of this is to gauge general stock market strength. For example, Apple and Microsoft make up roughly 7% of the S&P 500, if those two stocks rally while the rest of the stocks trade in a narrow range, the S&P will likely be up on the day. A few disproportionately weighted stocks on extended rallies can make the market look stronger than it really is if the rest of the stocks are not following suit. This is where the Advance Decline Ratio comes in. It measures either confirms the positive (or negative) action in the market, or there is a divergence between the two.
In the example below, you can see that $ADD confirms most price action from the S&P, that a few stocks aren’t driving the rallies or pullbacks.
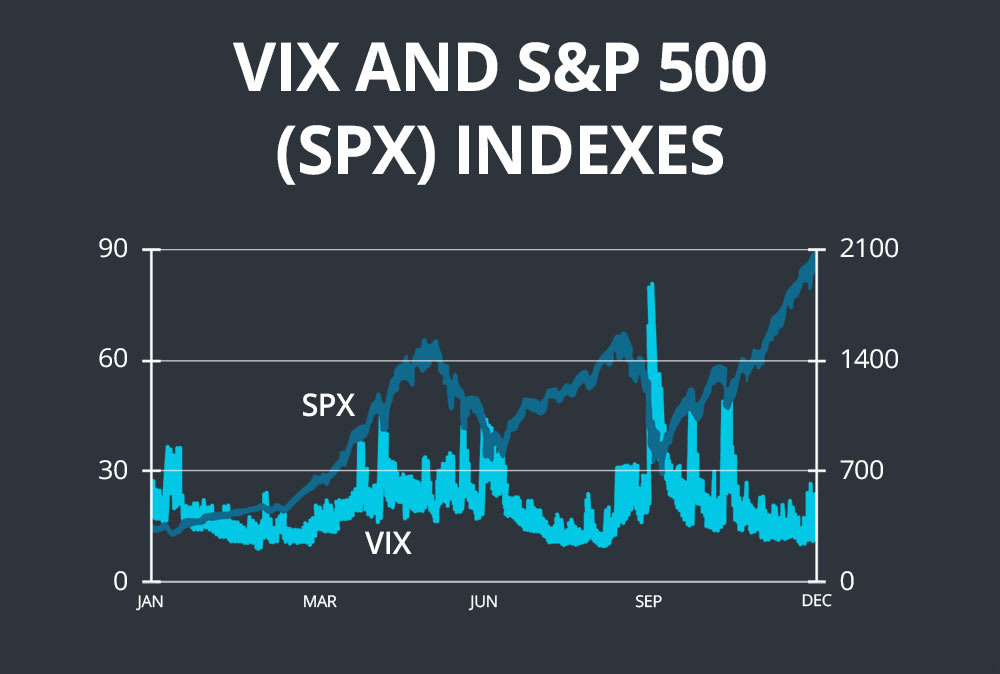
The S&P 500 Volatility Index - The VIX
By far the most well known indicator in this article, the VIX is widely known as the “fear index” by most traders and investors. The VIX essentially projects out the expected volatility for the next 30 days, on an annualized basis. For example, if the VIX is at 20 right now, the market (based on it’s own activity) is projecting the next 30 days to have the volatility of 20%, on an annualized basis. Basically, when people are getting scared and buying insurance against their portfolio, the VIX goes up.
The VIX has a historically negative correlation with the S&P 500.
There are many ways to use the VIX as an indicator. The first one involves the VIX serving as a leading indicator the market. Essentially using it for convergence or divergence. As noted above, the VIX has a negative correlation with the market, so when the VIX spikes, the S&P is likely to follow with a sharp down move. Combining this with your other trading analysis is sure to improve your results.
The next effective use of the VIX is to take advantage of it’s mean reverting nature. If you’re familiar with options trading, one of the core tenants of premium sellers is that implied volatility is overstated. This fact is evidenced by models created by options trading/education firm Tastytrade in the below graph:
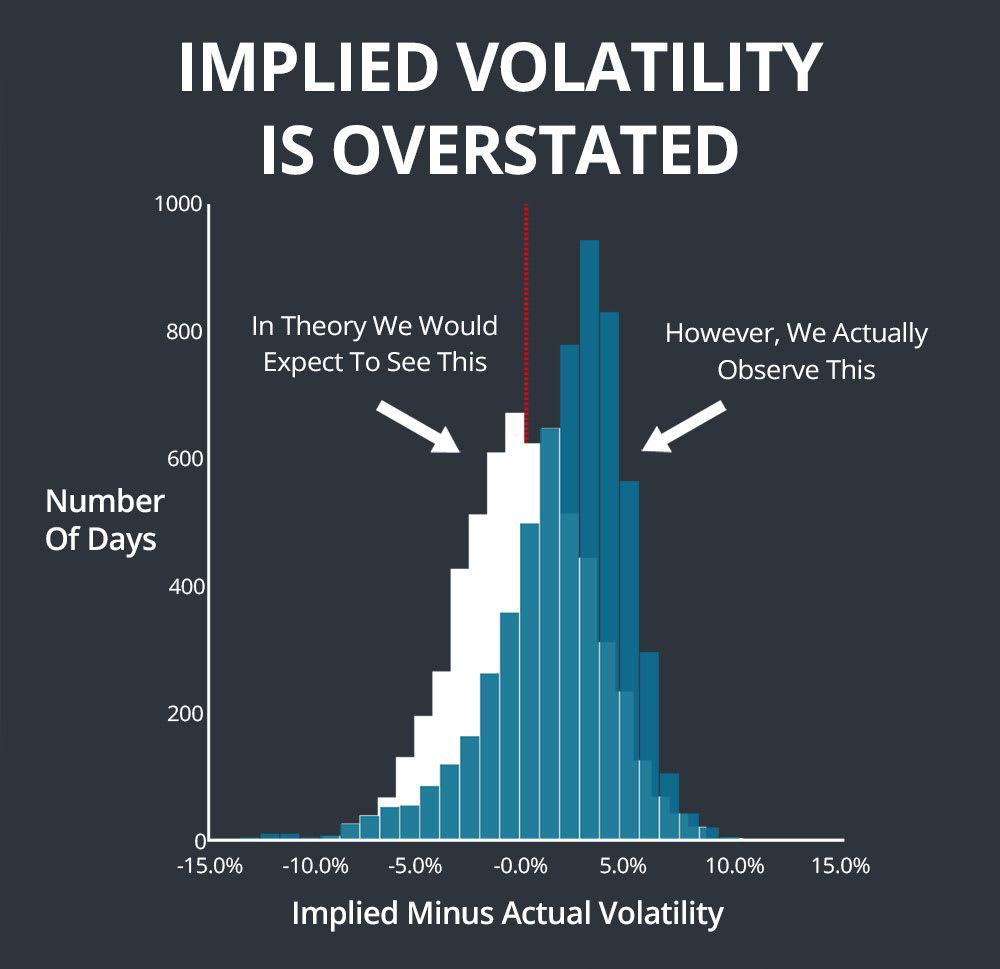
To sum up these findings, when implied volatility is high, it’s time to sell, as their is premium built into that high price, in other words, it’s a positive expectancy bet. Because the VIX is simply a measure of SPX’s implied volatility, one can use these volatility tendencies on the VIX.
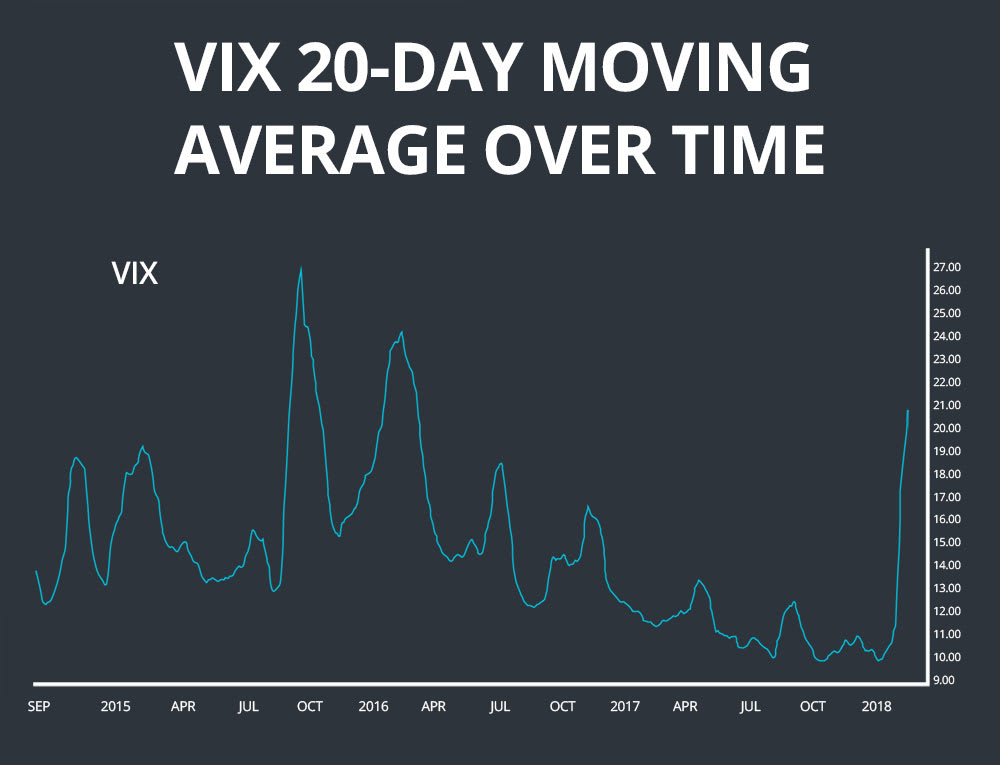
Simply looking at a moving average (20-day) of the VIX over time, we can see volatility’s mean reverting nature in action.
Related Reading:
- Using Market Internals to Improve Your Trading
- 10 Actionable Trading Lessons for Technical Traders
- A Comprehensive Guide to Moving Averages
Ready to start scanning? Try for free and choose the plan that fits your workflow.