What is an oversold bounce, and why do panic sell-offs bounce?
An oversold bounce is the rebound in a stock that has fallen further and faster than its buyers and sellers can absorb. The term covers two different trades. Swing traders mean a stock whose daily RSI has dropped under 30 after days of selling, bought for a few days’ recovery. Day traders mean the bounce after a capitulation flush: one session’s panic, a stock down 15%, 30% or 50% on several times its normal volume, bought once the selling visibly stops. This page teaches the day trade as the main play, because that is what the scan and signal below find, and covers the daily-RSI swing version under Variations.
Why a flush bounces, in the terms traders use:
- Forced and frightened sellers finish. A flush is stop-losses, margin calls and holders who sell at any price, all in the same minutes. Once they are out, the next seller has to be persuaded, and price lifts on nothing more than the absence of sellers.
- Shorts cover. Traders who shorted the breakdown are sitting on a quick gain and buy to lock it in at the first sign of a turn. Their buying is the first leg of most bounces.
- Price is far from where the day’s buyers paid. VWAP, the day’s average price, sits well above a flushed stock. Every buyer since the open is losing, and the gap between price and VWAP is the room a bounce has to travel.
How big is a bounce, on average? In US stocks over $10 from 2000 to 2002, NASDAQ stocks that fell an average 12.23% within an hour, on moves at least eight times their normal hourly volatility, recovered 1.93% in the next 60 minutes (215 events; NYSE stocks fell 7.56% and recovered 1.02%) (Zawadowski, Andor and Kertész). The average bounce is a sixth of the drop, not a round trip. The same study found NYSE spreads widened to about six times normal after the drop, which ate most of the gain. Read it as a reason to take profits at the first target and to keep the stop under the low, not as a promise.
Not every drop is the same, either. Across stocks with analyst coverage from 1995 to 2009, one-day shocks of 10% or more that came with analyst reports kept going the same way, and shocks without them reversed (Savor, 2012, CFA Institute summary). That is the research version of the trader’s rule: a panic bounces, a repricing does not. A stock that fell because it sold new shares or failed a trial is worth less than it was yesterday; a stock that fell because everyone sold at once may not be.
How do you scan for a capitulation flush?
The scan’s job is to put the handful of stocks in a real panic on one screen, so you are watching four charts and not the whole market falling. Scanz does it in two parts: a Data scan that lists the flushes, and a Signal that tells you when one of them prints its first green candle.
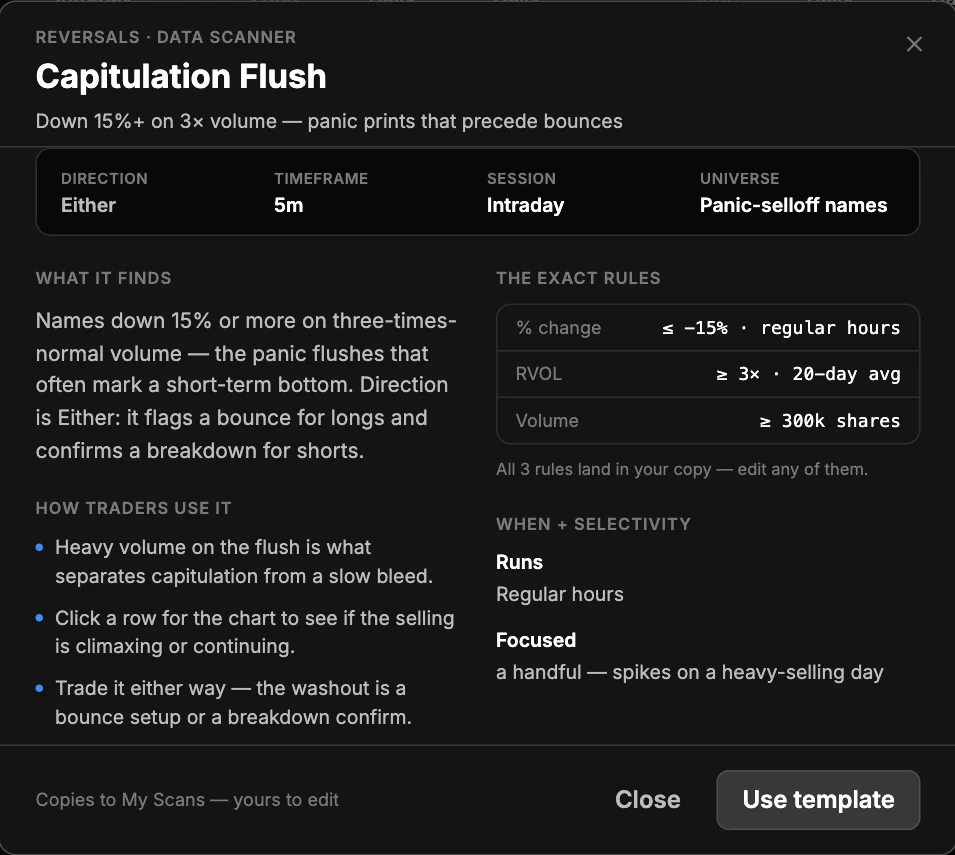
The list: Capitulation Flush. In Discover, choose Data Scanner, open the Reversals tab, click Capitulation Flush and click Use template; your copy opens as Capitulation Flush (copy) and is saved in My Scans.
The scan · Data Scanner · Regular hours, from 9:30 ET
Capitulation Flush: the template as stored, and your copy
| Rule | Setting | Why it's there |
|---|---|---|
| Percent Change, Regular Hours (vs yesterday's close) | Stored: ≤ −15. Your copy: the same | Down 15% or more from yesterday's close. A 5% red day is a bad day; 15% is where forced selling starts to show. The rule is live, so a stock that bounces back above −15% drops off the list. |
| Relative Volume, Regular Hours, 20-day average (shown RH[/20]) | Stored: ≥ 3. Your copy: the same | Today's regular-hours volume is at least three average days. Heavy volume is what separates a capitulation from a slow bleed. It is cumulative, not matched to time of day, so a stock passing it at 10:00 am is trading far above its normal pace (see the relative volume guide). |
| Volume, Regular Hours | Stored: ≥ 300,000 shares. Your copy: the same | Enough shares traded since the open that the move is real trading and you can get in and out. |
| Last Price | Stored: none. Your copy: ≥ 1 | Nine of the 12 stocks the template listed at noon on November 20, 2026 were under $1, where the spread is a large share of any stop and the prints are thin. |
7 days of Pro, card required.
What RVOL means here. The template’s relative volume is today’s regular-hours volume against a full average day, not against the same time of day. A stock that flushes at 9:55 needs three whole days of volume in 25 minutes to make the list; one that flushes at 2:30 pm needs the same three days spread over five hours. Early flushes therefore list late, sometimes after the low. The relative volume guide explains the measure and what the number means at each hour.
What the grid shows, and the column to add. The template’s columns are Last Price, % Chg 15m, Vol 15m and Trades 15m (all including extended hours), Float, RVOL RH [/20] and News Count 4h, sorted by the 15-minute change. That sort is useful: the stocks bouncing right now sit on top, the ones still falling at the bottom. Add % Chg RH, the change from yesterday’s close, so you can see how deep each flush is. News Count 4h counts headlines in the last four hours; click the row and read them before you buy anything (QuickView guide).
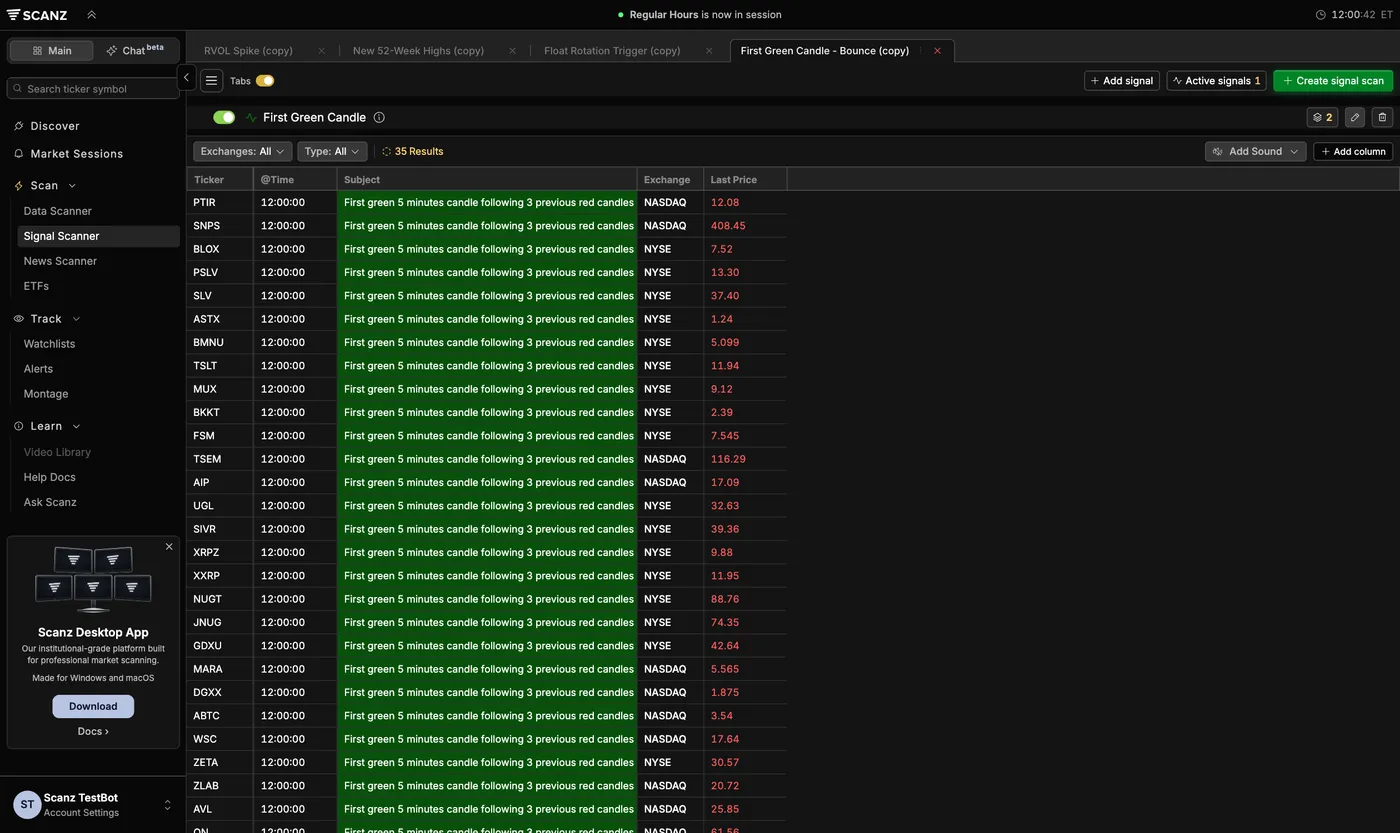
The timing: First Green Candle - Bounce. In Discover, choose Signal Scanner, open Reversal Signals, click First Green Candle - Bounce and click Use template; it opens in My Signals. The signal fires when a 5-minute candle closes green after three or more red ones, on a stock down 5% or more on 200,000 shares. Its editor (the pencil) shows the Candle Interval, 5 minutes, the number of preceding red candles, 3, and a box to include extended-hours candles, which is off, so only regular-hours candles count.
The scan · Signal Scanner · Regular hours
First Green Candle - Bounce: the signal as stored
| Rule | Setting | Why it's there |
|---|---|---|
| Signal: First Green Candle | 5-minute candles, 3 preceding red candles, extended hours off | Three red candles in a row is a stock being sold without a pause. The first green one is the first 5 minutes in which buyers won, the earliest sign the flush is ending. |
| Percent Change, Regular Hours | ≤ −5 | Keeps the signal to stocks having a bad day. It is looser than the flush list on purpose: it is the trigger, and the list is the filter. Fires on a stock down 5% to 15% are not this setup. |
| Volume, Regular Hours | ≥ 200,000 shares | Leaves out stocks too thin to trade. |
Run the two side by side. A signal on a stock that is not on your Capitulation Flush list is a stock having an ordinary red day; skip it. At noon on November 20, 2026 the signal fired on 35 stocks in the same candle, most of them silver, gold-miner and crypto funds bouncing with the market; none of them was on the flush list. The signal tells you when, the list tells you which.
What are the entry, stop and exit rules?
This is the trade most traders searching for an oversold bounce after a panic take: wait for the flush, buy the first candle that shows buyers took over, and put the stop under the low of the day. It is the common core of Lance Breitstein’s “right side of the V” (TradeZella), the morning panic dip taught by StocksToTrade (enter on the first green 5-minute candle, risk to the low of the day) and the extreme-reversal entries taught at Bear Bull Traders (a new 5-minute high after an hour of selling, VWAP as the target).
The setup on one card
- The flush
- On the Capitulation Flush list by the time the entry fills: 15% or more under yesterday's close at the day's low, RVOL 3 or more, 300,000 shares. The low of the day is at least 10% under today's open, so the selling happened during the session, not overnight.
- Price
- $1 or more
- Time window
- The signal candle closes between 9:50 and 3:00 pm ET
- Trigger
- The First Green Candle - Bounce signal fires on the stock: the first green 5-minute candle after three or more red ones
- Entry
- Buy stop a cent over the signal candle's high. If the stock makes a new low before it fills, cancel the order and wait for the next signal.
- Stop
- A cent under the low of the day
- Size
- The dollar risk you accept divided by entry minus stop. With $100 at risk, ACRV below ($1.13 entry, $0.169 to the stop) is 590 shares, about $670; ABVX ($72.46 entry, $9.50 to the stop) is 10 shares, about $725.
- First target
- Half off at VWAP or at 1R (the entry plus the entry-to-stop distance), whichever is further. Then move the stop on the rest to the entry.
- The rest
- Sell at the close of the first 5-minute candle that closes under the previous candle's low. Anything still open goes at 3:55 pm ET.
- Skip it when
- The price is under $1; the drop came with an offering or other new shares, a failed trial or regulatory rejection, a guidance cut, a going-concern or delisting notice, or a merger, reverse split or other corporate action; the stock is halted or just reopened; the signal fires before the stock is down 15%
Why each rule is there:
- 15% at the low, 10% under the open. The first green candle on a stock down 7% is a pause, not a flush; PMVP, below, fired the signal at −9.5% and then fell to −50%. Requiring the low to be 10% under today’s open keeps out the stocks that simply gapped down overnight and drifted, which are a different trade.
- $1 and up. Under $1, a cent is a large share of the risk, and many of these names trade in bursts with gaps between prints.
- 9:50 to 3:00 pm ET. The first signal possible is the 9:45 candle, after three red ones from the open. After 3:00 pm there is too little session left for the bounce to reach a target before the close.
- Over the signal candle’s high, not at its close. The green close says buyers won five minutes. Trading through its high says they are still there. A stock that makes a new low first has not finished flushing.
- Under the low of the day. The trade says the low is in. If it breaks, the panic was not over and the thesis is wrong.
- VWAP or 1R. VWAP is where the day’s average buyer stands and the target most traders who publish this play use. On a stock that bounced hard before you got in, VWAP can be below your entry, so 1R is the floor for the first target.
- The trail on the rest. A bounce that is still running closes each 5-minute candle above the last one’s low. The first close under it ends the bounce for this trade.
- The skips. An offering adds shares and a seller who has to finish selling; a failed trial or a delisting notice changes what the company is worth. Those stocks are repricing, not panicking, and they are the ones that keep flushing. A merger or reverse split moves the price for reasons that have nothing to do with selling pressure.
What Scanz cannot tell you. Why the stock fell. News Count counts headlines, and an offering priced overnight may show up only as a filing; read the News & Filings tab under the stock’s chart, or SEC EDGAR, before you buy a flush. Scanz has no halt data.
A real session: the Capitulation Flush list on November 20, 2026
November 20 was a down day: SPY fell about 2% by noon. That fills a flush list. The Capitulation Flush template, opened from Discover at 12:00:39 ET, listed 12 stocks.
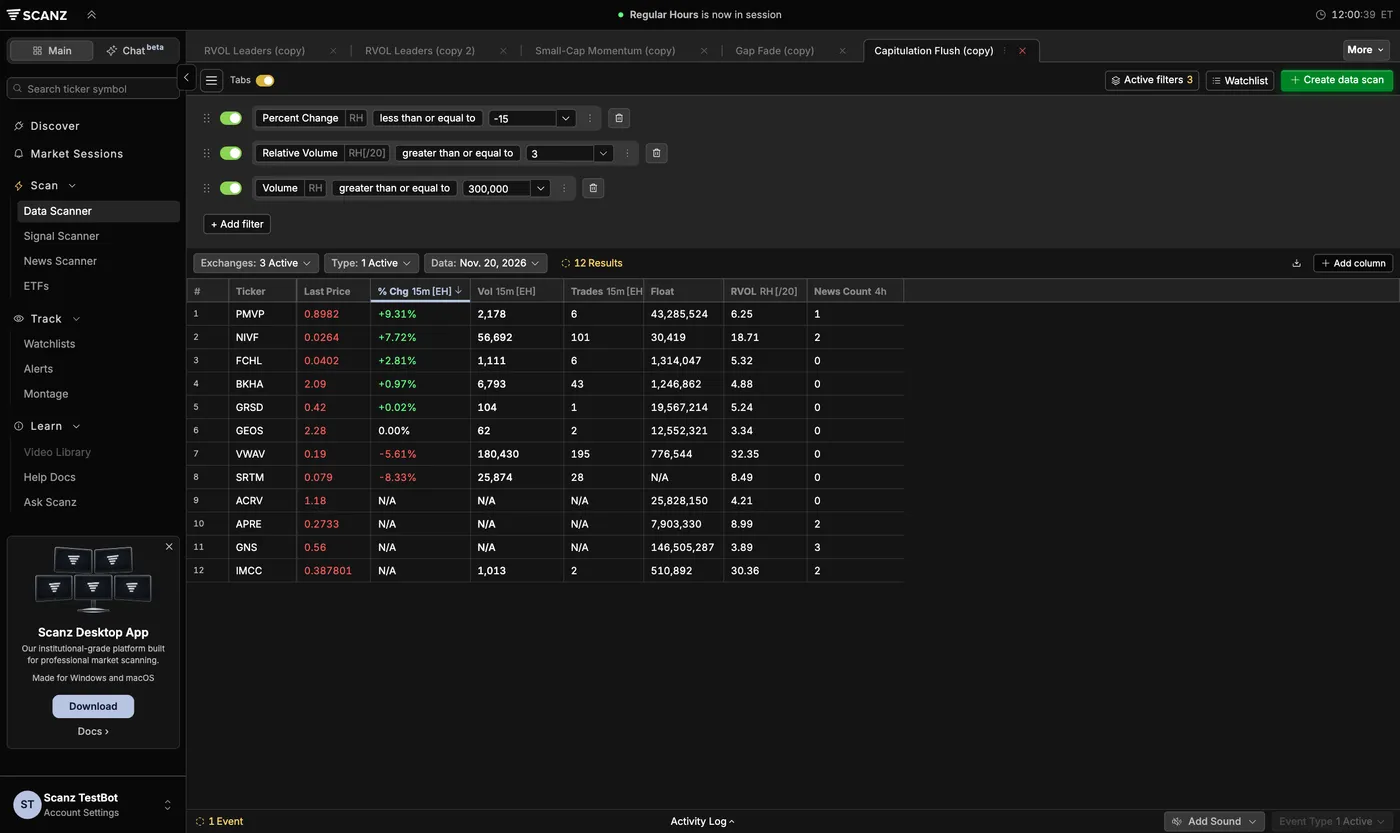
Where the numbers come from. The list, its columns and the RVOL values are Scanz captures from 12:00 ET. The 5-minute bars, VWAP and volumes below are public 1-minute consolidated data, with VWAP computed from it; the card is applied to those bars by rule, one trade per stock at a time, through the 4:00 pm close. Scanz’s own First Green Candle - Bounce feed was saved every 30 minutes until 2:00 pm ET (the capture machine slept from 2:14 to 3:35 pm); it confirms the VWAV, FCHL and SRTM signals below, and it fired some stocks on a different candle than the public bars show, such as GRSD at 12:30. The ledger uses the public bars throughout. Filings were read on SEC EDGAR.
ACRV: the card’s trade
| Time (ET) | What happened |
|---|---|
| Open | Opened flat at $1.40, yesterday’s close. Drifted to $1.33 by 10:15 on about 100,000 shares. |
| 10:20 to 10:35 | The flush: three red 5-minute candles, $1.34 to a low of $0.9709 in the 10:30 candle, on 204,000 shares in that candle alone. Down 30.7% at the low, 30.6% under the open. |
| 10:35 to 10:40 | First green candle after three red: opened $0.9857, closed $1.12, high $1.12. The signal. Price over $1, so the card applies. |
| The card’s math | Buy stop $1.13, stop $0.9609 (a cent under the low): $0.169 of risk, 15% of the price. VWAP was $1.17, less than 1R away, so the first target is 1R: $1.30. |
| 10:40 | Filled at $1.13. |
| 11:10 | Traded $1.32. Half off at $1.30: +1R. Stop on the rest to $1.13. |
| 11:30 | The 11:30 candle closed at $1.236, under the previous candle’s $1.242 low. The rest sold there, +0.63R. Trade: +0.81R. |
| 12:00 | On the list at $1.18, RVOL 4.21. |
ABVX: a $70 stock, a five-minute flush and a wide stop
ABVX is the liquid case: a $70 stock that averages about 850,000 shares a day (public daily volume, last 20 sessions). It was not on the noon list, because by noon it had bounced back to −11.5%, which is the point of watching the list live.
| Time (ET) | What happened |
|---|---|
| 9:30 to 9:50 | Opened at $79.01 against an $80.65 close and drifted, two red 5-minute candles in a row. |
| 9:50 to 9:55 | The flush: $78.88 to $63.30 in one candle on 945,000 shares, more than a normal day’s volume in five minutes. The third red candle. |
| 9:55 to 10:00 | Low of the day, $62.97, 21.9% under yesterday’s close, then a green candle to $71.44 on 1.23 million shares. The signal. By public volume counts the stock had traded about 2.9 average days by 10:00: RVOL 3 came with this candle or the next, after the low. |
| The card’s math | Buy stop $72.46, a cent over the signal candle’s $72.45 high. Stop $62.96: $9.50 of risk, 13% of the price. VWAP, about $70, was under the entry, so the first target is 1R: $81.96, above yesterday’s close. |
| 10:00 to 10:10 | Two candles under $72, no new low. The buy stop filled in the 10:10 candle, which ran to $74.00. |
| 10:35 to 10:55 | Back to $65.31, under VWAP but $2.35 above the stop. |
| 12:00 to 12:50 | Climbed to $74.95, the high after the entry, and held near $74. |
| 2:00 to 3:55 | Drifted between $72 and $74 and never came near the $81.96 target or the stop. Sold at the 3:55 pm close, $73.28: +0.09R. |
ABVX is what the low-of-day stop costs on a single-candle flush: the signal candle recovered half the drop by itself, so the entry was far above the low and the stop far below it. The trade was right about the bounce and made almost nothing on it, because 1R was a $9.50 move. The tighter stop under Variations, under the signal candle’s low at $62.96, is the same here; the versions that help are a smaller position, or waiting for the VWAP reclaim, which whipsawed around $70 until it held from 11:40.
PMVP: the signal that fired before the flush
PMVP opened at $1.34, above yesterday’s $1.31 close, and slid through the morning. At 10:20 it printed a green candle after seven red ones, down 9.5% on 328,000 shares: the template’s signal conditions were met. It was not a flush. The low was 13% under yesterday’s close, the stock was not on the list, and the card does not take it. The buy stop over that candle, at $1.21, never filled: PMVP made a new low first, then fell from $1.19 at 10:30 to $0.66 by 10:57, down 50% on the day at the low. A trader who bought the first green candle at its close, $1.185, would have been down 44% before lunch.
This is the flush that keeps flushing, and it is why the card waits for 15%. The 15% line does not guarantee the selling is done; it keeps you from buying the first pause of a stock that has not yet panicked.
VWAV: a flush with no bounce
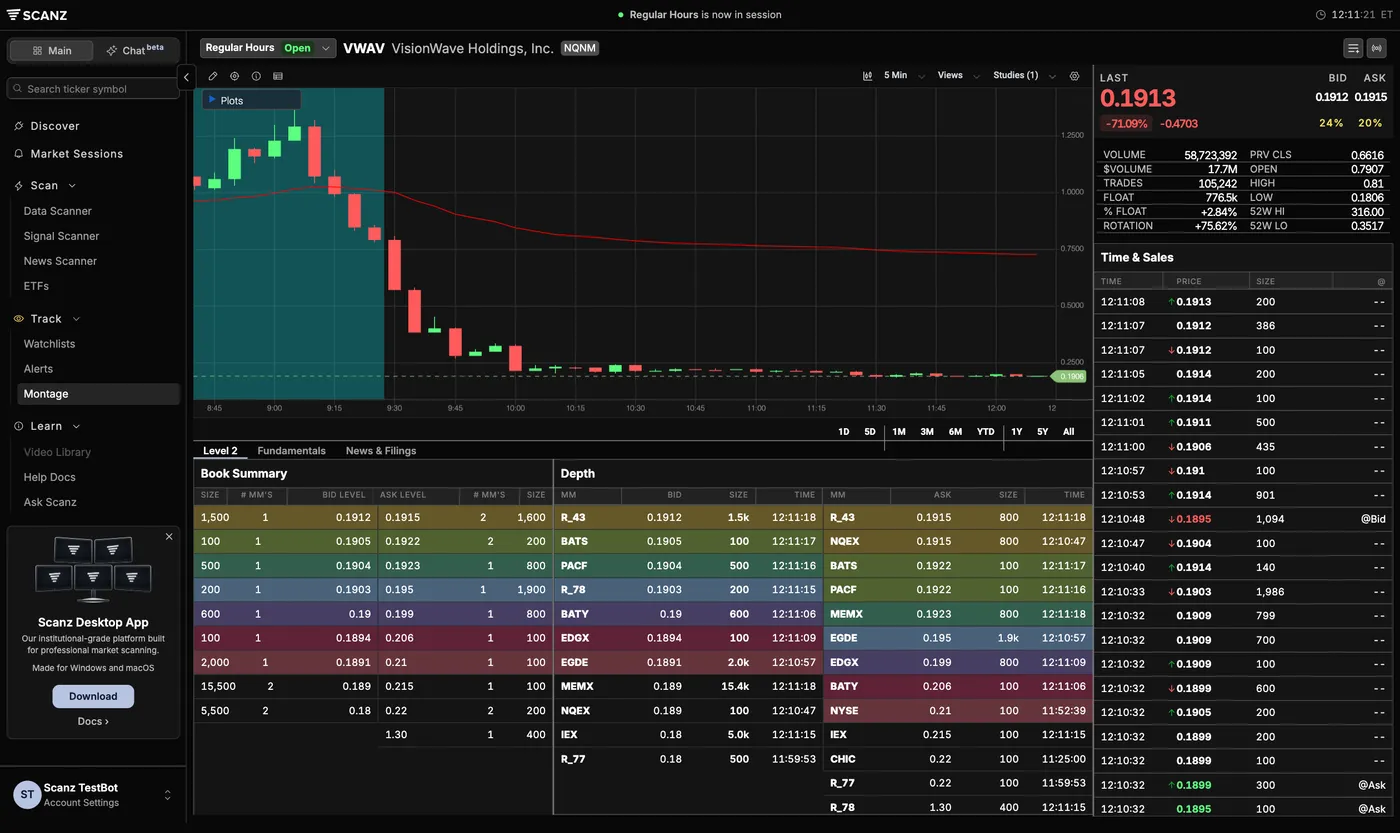
VWAV, VisionWave Holdings, opened at $0.79, 19.5% above yesterday’s close, and was at $0.38 ten minutes later. It was under $1, so the card would not have touched it. But it is the picture of what this setup risks: there was no first green candle after three red to buy, because the stock never stopped long enough. By 12:40 it was $0.17, down 75% at the low. Its first signal came at 12:45, on Scanz’s own feed, at $0.175; it closed the day at $0.18, down 72.5%. The company filed an 8-K that day about buying software for a promissory note; nothing in the filing explains a 74% fall, and News Count 4h showed no headline at noon. A flush without a reason you can read is still a flush you cannot predict.
BKHA: on the list, and not a flush
BKHA opened at $2.24 against a $6.48 close, down 65% before the first trade, and was on the noon list. That day the company filed an 8-A registering the common stock of Vesicor Therapeutics, the company formed in its merger, for Nasdaq under a new symbol, VESI. The price change is the merger, not a panic. The card’s numbers would have taken it: a 13% drop from the open, a signal at 9:45 and a +1.63R trade by 10:10, then a second signal at 11:20 and a −1R stop at 2:25 pm, when the stock broke the morning low on its way to $1.76, down 72.8%. The corporate-action skip rules it out. Read the filings before the chart.
Every flush on the noon list, and what the card did
The card applied by rule to every stock on the 12:00 list, plus ABVX, which was not on the noon list but fell from $78.88 to $63.30 in the 9:50 candle and was back above −15% by noon. Results are to the 4:00 pm close.
| Stock | Low vs yesterday’s close | Card | Outcome |
|---|---|---|---|
| ACRV | −30.7% | Signal 10:35, bought $1.13, stop $0.9609 | +0.81R: half at 1R 11:10, rest 11:30 |
| ABVX | −21.9% | Signal 9:55; RVOL near 3 by 10:00, so on the list before the 10:10 fill. Bought $72.46, stop $62.96 | +0.09R: never reached 1R, $81.96, which is above yesterday’s close; sold at 3:55 pm |
| GEOS | −38.2% | Skip: the 11:15 signal came before 300,000 shares; the gap followed results filed the night before | +0.15R at 3:55 pm had it been taken |
| BKHA | −72.8% | Skip: merger | Would have been +1.63R, then −1R when it broke the morning low at 2:25 pm: +0.63R |
| PMVP | −49.6% | Skip at 10:20: down 13%, not yet a flush. Later signals under $1 | The 10:20 candle’s buyers lost 44% |
| APRE | −58.7% | Skip: under $1, and the drop followed updated trial results filed that day | Two signals: +1.47R, then −0.58R; closed down 53.6% |
| NIVF | −34.6% | Skip: under $1, and share-offering prospectuses (424B5) filed that day and the day before | Its 11:20 signal: +0.31R at the close |
| GRSD | −49.6% | Skip: under $1 | Its 11:35 signal stopped at 2:30 pm: −1R |
| SRTM | −27.1% | Skip: under $1 | Its 12:05 signal (12:10 on Scanz’s feed): +1.14R at the close |
| FCHL | −77.3% | Skip: under $1 | Two signals, 9:45 and 1:40 pm (1:45 on Scanz’s feed), both stopped: −2R |
| VWAV | −74.8% | Skip: under $1 | First signal 12:45 pm: +0.32R at the close |
| PMVP (after 10:20) | −49.6% | Skip: under $1 | Its 10:55 signal: +0.06R at the close |
| GNS, IMCC | −53.6%, −22.8% | Skip: under $1; no signal that filled | GNS made a new low before each of its signals could fill |
The card took two trades, ACRV +0.81R and ABVX +0.09R: +0.90R. Without the $1 rule it would have taken nine more, on PMVP, APRE (two), GRSD, SRTM, FCHL (two), VWAV and NIVF: four losers, five winners, −0.28R in all, and two of the winners (APRE, NIVF) are stocks the news skips would also have removed. BKHA, had the merger skip not existed, adds +0.63R. One session, on a day SPY fell 2%, is an illustration, not a record. What it shows is the shape of this list: most flushes are cheap stocks with a reason to fall, and the card’s skips remove nearly all of them.
How does the trade change with the timeframe and the stock?
The daily RSI version: the Oversold Bounce template
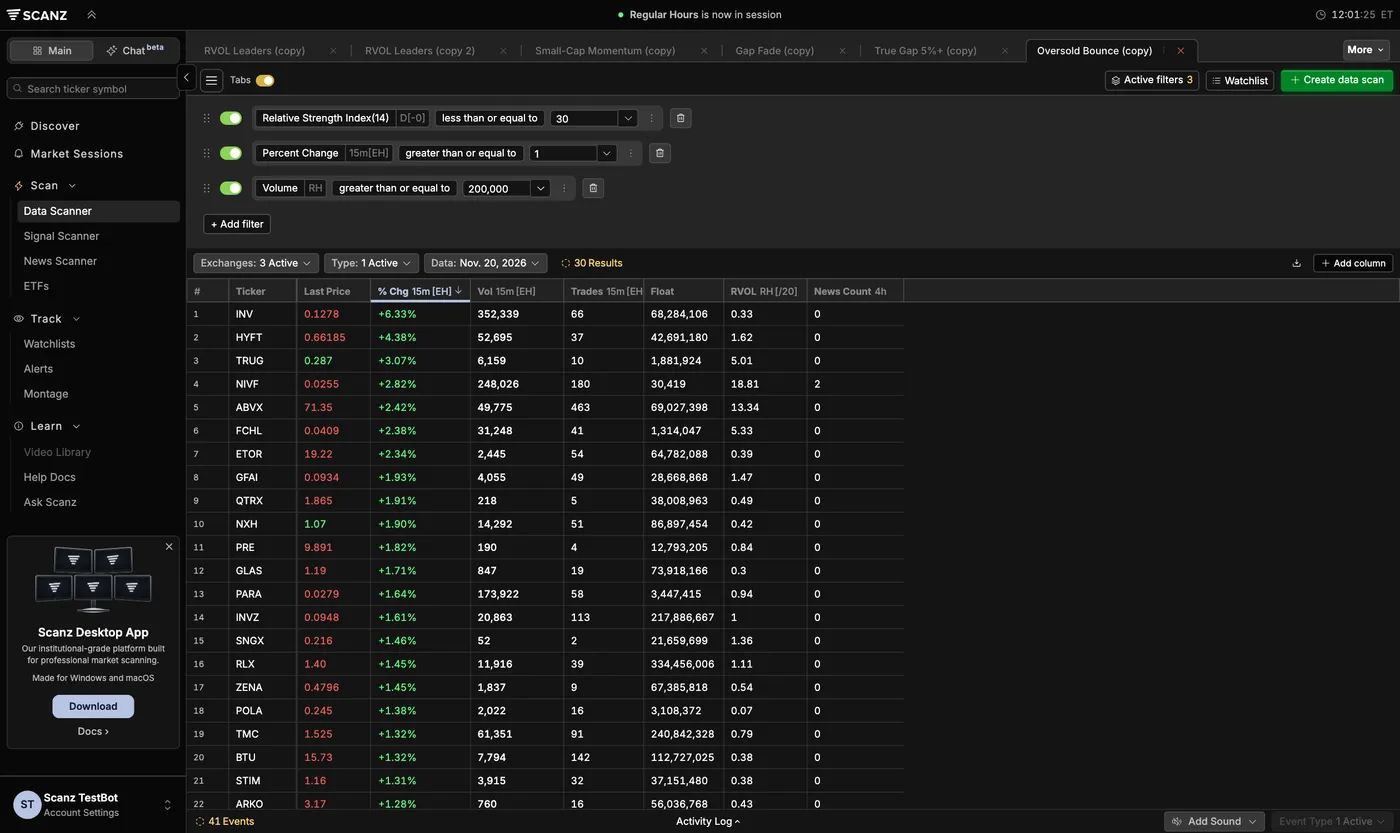
Discover → Data Scanner → Reversals → Oversold Bounce is the swing version most “oversold bounce” pages describe. Its three rules are Relative Strength Index on the Daily interval at 30 or less, Percent Change over the last 15 minutes at +1 or more, and Volume, regular hours, at 200,000 shares or more: a stock oversold on the daily chart that is bouncing right now.
The scan · Data Scanner · Regular hours
Oversold Bounce: the template as stored
| Rule | Setting | Why it's there |
|---|---|---|
| Relative Strength Index, 14, Daily, Current day (shown [-0]) | ≤ 30 | Oversold on the daily chart. Current day means today's price counts as today's close, so the reading moves through the session. |
| Percent Change, last 15 minutes | ≥ +1 | Up 1% or more in the last 15 minutes: the bounce has started. |
| Volume, Regular Hours | ≥ 200,000 shares | Enough trading since the open to take a position. |
How the daily RSI reads during the day. Because the RSI rule uses the current day, a stock can enter the list in the middle of a sell-off. At 12:01 ET on November 20, the list held 30 stocks, including ABVX: its 14-day RSI on completed daily closes was about 37, and with the noon price standing in for today’s close it was about 29 (Wilder’s RSI computed from public daily closes; Scanz’s own value can differ by a point or two). The same works in reverse: a stock that bounces can climb back over 30 and drop off the list.
What daily RSI misses. RSI under 30 takes several down days. A stock that was fine yesterday and flushes today often stays above it: PMVP, down 31% at noon, had a daily RSI of about 51 the day before and about 32 at noon; BKHA went from about 48 to about 32. Neither was on the Oversold Bounce list. Use this template for stocks that have been falling for days and the Capitulation Flush list for today’s panic. The trade is different too: swing traders who use it, such as the ones Arthur Hill describes, usually require the stock to be in a long-term uptrend and sell on the first bounce days later. This page does not measure that version.
The second entry: the VWAP reclaim
Traders who want more proof wait for the bounce to reach VWAP and buy the first 5-minute close back above it, with the stop under that candle or under the higher low the bounce made. They pay a worse price and skip the bounces that stall under VWAP, which are most of them; the ones that reclaim it often run to yesterday’s close and become a red to green move. The VWAP guide has the reclaim’s rules. On a flush, the first target of this page’s trade is the entry of that one.
A tighter stop: under the signal candle
Some traders put the stop a cent under the signal candle’s low instead of the day’s low. It shrinks the risk on a stock like ACRV, where the low was 15% under the entry, and it gets stopped more often by a retest of the low. Use it with the same entry and targets; never move it lower once the trade is on.
The panic dip in a stock that ran
The best-known version of this play among small-cap traders is the morning panic dip in a stock that has run for days, taught by Timothy Sykes and StocksToTrade: a former runner drops 30% to 50% at or soon after the open, and traders buy the first green 5-minute candle with the risk to the low of the day. It is the same entry and stop. Two things change: the flush is usually in the first 30 minutes, so the Capitulation Flush list’s cumulative RVOL is late and the signal is your first alert; and these stocks are often under $1 or about to sell shares, so the skips matter more, not less.
Large caps and market-wide flushes
When the whole market flushes, large caps on the list are falling with the index, not on their own news, and their bounce usually waits for SPY and QQQ to turn. On those days traders watch the index’s 5-minute chart and take the signal on a stock only after the index has printed its own first green candle. Large caps rarely fall 15% in a day without a reason; lowering the copy’s Percent Change to −8 widens the list for them, with the same news check.
Why do oversold bounces fail, and what can’t the scan see?
- The flush keeps flushing. The list shows stocks that have fallen, not stocks that have finished falling. PMVP and VWAV were both on it, and both kept going. The 15% line, the signal, the buy stop over the candle’s high and the stop under the low are there because “oversold” is not a reason to buy.
- The drop is a repricing. An offering, a failed trial, a guidance cut or a going-concern notice changes what the stock is worth. Those stocks drift lower for days (Savor, 2012). The scan cannot read a filing for you; News Count counts headlines.
- A dead-cat bounce. The first bounce often recovers a fraction of the drop and rolls over, as the study above shows on average. That is why half comes off at the first target and the stop moves to the entry.
- Spreads and halts. Spreads widen after a flush, so the entry and the stop both fill worse than they print. A stock that halts on the way down can reopen far under your stop; Scanz has no halt data.
- The list is late on early flushes. Cumulative RVOL needs three average days of volume. ABVX’s 9:50 candle took it from $78.88 to $63.30, and by public volume counts it reached RVOL 3 only around 10:00, after the low, by which time it was trading near −15%.
- Market days. On a broad sell-off the signal fires on dozens of stocks on the same candle, as it did at noon on November 20. That is the market bouncing; it says nothing about any one stock.
- Size. A low-of-day stop on a flush is often 10% to 25% of the price. Sizing it like a normal trade is how a bounce trade turns into the worst day of the month.
The checklist before you buy the bounce
Before the buy
- Is it on the Capitulation Flush list: 15% or more under yesterday's close at its low, RVOL 3 or more, 300,000 shares?
- Is the low of the day at least 10% under today's open?
- Is the price $1 or more?
- Has the First Green Candle - Bounce signal fired on it, with the candle closing between 9:50 and 3:00 pm ET?
- Have you read the headlines and the filings, and is the drop not an offering, a failed trial or rejection, a guidance cut, a going-concern or delisting notice, a merger or a reverse split?
- Is the stock trading, not halted or just reopened?
- Is your buy stop a cent over the signal candle's high, to be cancelled if the stock makes a new low first?
- Is the stop a cent under the low of the day, and is the position sized from that distance?
- Do you know where half comes off (VWAP or 1R, whichever is further), how the rest exits (the first 5-minute close under the previous low) and when you are out (3:55 pm ET)?
Questions traders ask
What is an oversold bounce?
A rebound in a stock that has fallen further and faster than buyers can absorb. Swing traders use the term for a stock with a daily RSI under 30 after days of selling; day traders use it for the bounce after a single-session panic, a capitulation flush. This page's main trade is the day-trading version.
What is capitulation in a stock?
The point in a sell-off where the remaining holders give up at any price: stop-losses, margin calls and panic selling arrive together, usually on the day's biggest volume. Scanz's Capitulation Flush template lists stocks down 15% or more from yesterday's close on three times an average day's volume.
How do you know when a stock has bottomed?
You do not, in advance. Traders wait for the first sign that the selling stopped, the first green 5-minute candle after a run of red ones, and buy only when price trades over that candle's high, with the stop under the low. If the low breaks, it was not the bottom.
Is RSI under 30 a buy signal?
Not on its own. A daily RSI under 30 says a stock has fallen for days; it can stay under 30 for weeks in a downtrend. A stock that flushes in one day often stays above 30: PMVP, down 31% at noon on November 20, 2026, read about 32. Traders who use RSI pair it with a trend filter and a bounce that has already started.
What is a dead cat bounce?
A short rebound inside a decline that rolls over to new lows. Most flush bounces recover only part of the drop; in one study of large intraday drops in NASDAQ stocks, the average 60-minute rebound was 1.93% after a 12.23% fall. That is why the rules take half at the first target and move the stop to the entry.
What time of day do oversold bounces happen?
Many flushes come in the first hour, when the overnight sellers and the stop-losses hit at once: on November 20, 2026, most of the flushes on the noon list started before 10:30 ET. Afternoon sell-offs make a second batch. The rules stop new entries at 3:00 pm ET so a bounce has time to reach a target.
Where do you put the stop when buying a dip?
A cent under the low of the day. The trade assumes the low is in; if price takes it out, the panic is not over. A tighter version uses the low of the signal candle. Either way the stop is wide on a flush, so the position is smaller than usual.
Can you scan for oversold stocks before the market opens?
The Capitulation Flush and First Green Candle - Bounce templates are regular-hours scans; they list nothing before 9:30. The Oversold Bounce template's volume rule counts regular-hours shares, so it needs the session too. For stocks gapping down before the bell, use a pre-market scan and watch the open.