What is a parabolic stock, and why does it turn?
A parabolic stock is one whose price rises faster the higher it goes: each day’s gain, or each bar’s, is bigger than the last, so the chart bends upward like the curve it is named after. In day trading it almost always means a small cap that has run several hundred percent in a few sessions on a catalyst, a low float or a squeeze. The traders who short these moves put numbers on it: Kristjan Kullamägi looks for small caps up 300% to 1,000% or more, up three to five days in a row (his own description of the parabolic short); Marios Stamatoudis measures from the stock’s last touch of its 20-day moving average and wants about 200% for a small cap, 100% for a mid cap and 50% for a large cap (TradeZella’s write-up of his setup).
Why it turns, in the terms traders use:
- The buyers run out. A vertical move is fed by late buyers chasing it and by short sellers covering. Each new high needs a bigger buyer than the last. When one push makes a new high and nobody pays more, the stock has no one left to sell to.
- Everyone above VWAP is a seller. VWAP is the average price paid today. Once the stock trades under it, the average buyer of the day is losing money, and the people who bought the last leg are the most nervous holders in the market.
- Shares appear. A company whose stock has gone up five times can sell new shares into it, and holders who have been underwater for months finally can sell. Supply arrives on the move, not before it.
It turns late, though, and on its own schedule. Overbought is not a sell signal: Wilder, who invented RSI, called a reading above 70 overbought, and StockCharts’ own guide to the indicator notes that momentum oscillators can stay overbought in a strong uptrend (StockCharts ChartSchool). Every section below is built on that: the scan tells you the stock is stretched, and only the chart tells you it has turned.
How do you scan for parabolic stocks?
The scanner’s job is to put the handful of stocks that are stretched today in front of you, so you are watching three charts for the turn and not fifty. Scanz’s Overbought & Extended template does that with three rules. In Discover, choose Data Scanner, open the Reversals tab, click Overbought & Extended and click Use template; your copy opens as Overbought & Extended (copy) and is saved in My Scans.
The scan · Data Scanner · Regular hours, from 9:30 ET
Overbought & Extended: the template as stored, and your copy
| Rule | Setting | Why it's there |
|---|---|---|
| Relative Strength Index (14), Daily, current day (shown D[-0]) | Stored: ≥ 75. Your copy: the same | The 14-day RSI is in overbought territory, five points past Wilder's 70, so the stock has risen on most of the last two weeks' closes. The current-day setting counts today's move as it happens, so a stock can join the list during the session (below). |
| Percent Change, Regular Hours (vs yesterday's close) | Stored: ≥ 5. Your copy: the same | Up 5% or more today. Keeps the stocks that are still being pushed and drops the ones that are overbought but resting or already falling. |
| Volume, Regular Hours | Stored: ≥ 200,000 shares. Your copy: the same | Shares traded since 9:30, so the move has real trading behind it and the chart can be read. |
| Last Price, twice | Stored: none. Your copy: ≥ 1 and ≤ 20 | Under $1, a cent of spread is a big share of any stop, and those are the stocks brokers are least likely to lend. Over $20, stocks rarely run the several hundred percent this page is about, and the main card does not take them (the test below shows why). |
7 days of Pro, card required.
What the template finds, and what it doesn’t. The card in Discover says it plainly: a watch list for exhaustion, not an instant short. It lists stocks that are stretched; it does not list stocks that have turned. A stock that is up 30% and still making new highs passes every rule, and so does one that has already cracked. Which of the two you are looking at is read off the chart, with the signs in the next section.
How the RSI rule behaves during the day. Scanz’s filter reference describes RSI as a 0 to 100 momentum oscillator and does not spell out the daily bar it uses (filter reference). The builder shows the rule as D[-0], the current day, and the two stocks the template listed at 12:01 ET on November 20, 2026 show what that means. From public daily closes, our own calculation puts AKAN’s 14-day RSI at 70.4 and ELOG’s at 71.5 at the close on November 19, both under 75. With November 20’s price in the last bar, they are 75.6 and 78.4. They were on the list because of the day’s move: the RSI rule reads today’s price as it changes, so a stock can join the list mid-session and leave it again if it falls back.
When the scan lists. Two of the three rules are regular-hours rules, so the list is empty before 9:30, whatever the pre-market did. The card’s own settings are a 5-minute timeframe, intraday, regular hours, and “a handful” of names: on November 20 it was two.
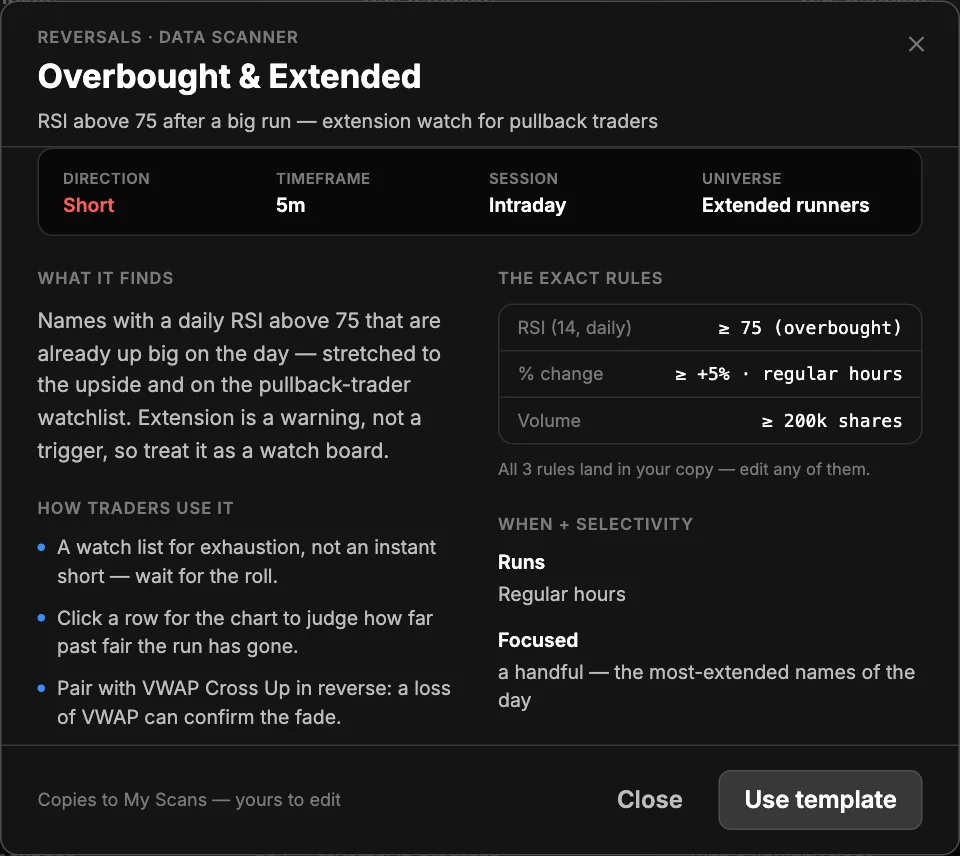
The columns to add. The template’s grid opens with Last Price, % Chg 15m, Vol 15m, Trades 15m, Float, RVOL RH and News Count 4h, sorted by the 15-minute change. That sort is useful for spotting which name is moving right now. Add % Chg RH, the change from yesterday’s close, to see the size of the day’s move; High, the day’s high, the level the turn has to fail under; and VWAP (Technical → Volume Weighted Average Price). A row whose Last Price is under its VWAP has cracked. Click a row for its chart and headlines (QuickView guide).
Settings to tighten or loosen.
- Only the real parabolics. Raise Percent Change to 20 and add Float less than or equal to 20,000,000. The list shrinks to the small caps doing the vertical moves this page is about.
- More liquid names. Raise Volume to 1,000,000 and the lower Last Price rule to 3, keeping the $20 cap. You will see fewer runners, with tighter spreads and fewer halts.
- Catch a stock as it joins. Turn on Entered in the Activity Log and give it a sound: each entry is a stock that has just become stretched, your cue to open its chart.
What does the turn look like on the chart?
This is the part the scan cannot do. On a 5-minute chart with VWAP, the turn shows in this order, and the rules below wait for at least the first three:
- A failed new high. The stock pushes above the day’s high and the bar closes back under the old high. On a parabolic small cap this is often a long upper wick on heavy volume.
- The first close under VWAP. The first 5-minute bar that closes under VWAP after the run is the crack. Until it happens, every dip has been bought above the day’s average price.
- A lower high. The bounce after the crack stops under the day’s high. Traders who bought the top use it to get out; that is what makes it a short.
- The tape changes. In Time & Sales, prints on the bid outnumber prints on the ask, and big prints at the ask stop moving the price. On Level 2, offers stack up and are not taken.
- Red bars carry the volume. Down bars trade more shares than the up bars between them.
Halts are part of reading a parabolic chart. Low-priced runners pause for five minutes or more under the limit-up/limit-down rules when they move too far too fast, in both directions. A stop order does nothing during a pause, and the stock can reopen well past it. Scanz has no halt data; Nasdaq publishes its halts in real time (Nasdaq Trader halts).
Which play do most traders take?
Traders who trade parabolic stocks split three ways, and each group has its own rules on this page:
- The patient short (the main play). Let the stock make its high and crack, then short the first bounce that fails under the high. Most of the pages that teach the parabolic short wait for this confirmation: Kullamägi enters on the break of the opening range low, the first red 5-minute candle or a failed bounce into VWAP, and warns against being early; Stamatoudis’s preferred entry is a failed VWAP reclaim, with the stop at the day’s high or the most recent lower high. It gives up the top in exchange for knowing the top is in.
- The early short. Short the first red day, or the failed break of the day’s high, before a lower high exists. Tim Sykes teaches the first red day. Tighter stop, earlier entry, and more trades that get run over.
- The long who trails. Traders who bought the run do not short it; they hold and trail a stop under it, and the turn is their exit. Ross Cameron and Kullamägi both publish how they do this.
The page leads with the patient short because it is the version the ranking pages teach and the one with a defined risk. Even Sykes, whose first red day is the best-known early short, writes that he does not recommend shorting to beginners (first red day) and that he prefers to trade the biggest runners from the long side (shorting supernovas).
What are the rules for the lower-high short?
The setup on one card
- The stock
- On the Overbought & Extended list; priced $1 to $20; at least three times its lowest close of the last 20 sessions (up 200% or more from where the run started); on at least the third session of the run
- The crack
- The day's high is in place and a 5-minute bar has closed under VWAP
- Time window
- Triggers from 10:00 to 15:00 ET
- Trigger
- After the crack, the first 5-minute bar that trades at or above VWAP and closes back under it, with its high under the day's high (a failed reclaim)
- Entry
- Short at the trigger bar's close, with a limit order at that price good for the next bar only. No fill, no trade.
- Stop
- A cent above the lower high: the highest price from the crack bar to the trigger, the crack bar included
- First target
- Half off at 1R, the entry minus the entry-to-stop distance. Then move the stop on the rest to the entry.
- The rest
- Covered at the first 5-minute close back above VWAP, or at 15:55 ET, whichever comes first
- Attempts
- Two per stock per day. After two stops, the stock is done for you today.
- Skip it when
- The stock has not closed a 5-minute bar under VWAP; it is the first day of the run; it is halted or has halted in the last 15 minutes; the stop is more than 15% above the entry; there is buyout or approval news that changes what the company is worth; your broker has no shares to lend
Why each rule is there:
- The size of the run. Stamatoudis’s line for a small cap is about 200% from the last touch of the 20-day moving average, and Kullamägi’s is 300% or more; three times the lowest close of the last 20 sessions is a version of that you can check from a daily chart. A stock up 40% on the day is a momentum stock, not a parabolic one, and it often just keeps trending.
- $1 to $20. The published versions also short larger stocks after a 50% to 100% run. In the test below, every one of those trades sat on a stop a few cents above the entry and most were stopped; the card kept the low-priced runners the lower-high short held up on. That choice was made after the test, which is said again there.
- Third day or later. First-day runners are the ones that go furthest. Sykes’s own example of the danger is TOP, which he says went from $6.53 to $250 in under 24 hours. Kullamägi wants three to five days up in a row.
- The crack before the trigger. Shorting above VWAP is shorting the buyers who are winning. The crack proves the day’s average buyer is underwater.
- A failed reclaim, not just any red bar. The bounce into VWAP is where the trapped buyers sell. A bar that gets back to VWAP and cannot close there is the moment they win the fight.
- Stop above the lower high. The lower high is the highest price from the crack bar on, because the crack bar often spikes first and then breaks. If the stock takes it out, the lower high was not one. A cent above it is where the idea is wrong, not where the pain is.
- Half at 1R. Parabolic stocks bounce hard. Taking half at 1R pays for the next stop and lets the rest ride a move that can go much further.
- VWAP reclaim for the rest. Kullamägi uses a reclaim of VWAP as the stop on a failed-VWAP short. Once the stock closes back above it, the day’s average buyer is winning again.
- 15% stop limit. AKAN’s 5-minute bars on November 20 ranged 13% to 17% at the open and after the halts. Past a 15% stop the position has to be so small that a halt reopening through the stop does the damage.
- No trigger within 15 minutes of a halt. The bars right after a pause reopen in an auction and swing hardest, and a stock that has just halted can halt again before your stop can fill.
- Two attempts. Stamatoudis allows two tries per stock; after the second stop the turn is not happening on your timetable.
The short side, once. To short a stock your broker must have reasonable grounds to believe it can be borrowed, and record that before the order, the “locate” in SEC Regulation SHO (SEC: key points about Regulation SHO). Runners like these are usually hard to borrow and can carry a high daily fee. Scanz has no borrow-fee, hard-to-borrow or locate data: check your broker before the trade, not at the trigger. And once a stock falls 10% from yesterday’s close, the SEC’s short-sale rule (Rule 201) lets new shorts fill only above the national best bid for the rest of that day and all of the next (SEC Rule 201 FAQ). The day after a big crack is usually a restricted day, so use a limit order at the trigger price, never a market order.
The checklist before you short the lower high
Before the short
- Is it on the Overbought & Extended list, priced $1 to $20?
- Is it at least three times its lowest close of the last 20 sessions, on at least the third session of the run?
- Has the day's high been made and has a 5-minute bar closed under VWAP?
- Is it between 10:00 and 15:00 ET?
- Did the trigger bar trade at or above VWAP and close back under it, with its high under the day's high?
- Is the stop a cent above the lower high (the highest price since the crack bar), and no more than 15% above the entry?
- Has the stock been free of halts for the last 15 minutes?
- Have you read the headline, and is it not news that changes what the company is worth?
- Does your broker have shares for you to borrow, at a fee you accept, and is your order a limit order?
- Is this your first or second attempt on this stock today?
- Do you know where half comes off (1R) and when the rest comes off (a 5-minute close above VWAP, or 15:55 ET)?
A real session: AKAN and ELOG on November 20, 2026
The Overbought & Extended template, opened from Discover at 12:01:43 ET, listed two stocks: AKAN and ELOG. They show the two things the list cannot tell apart, a runner that had turned and a runner that had not.
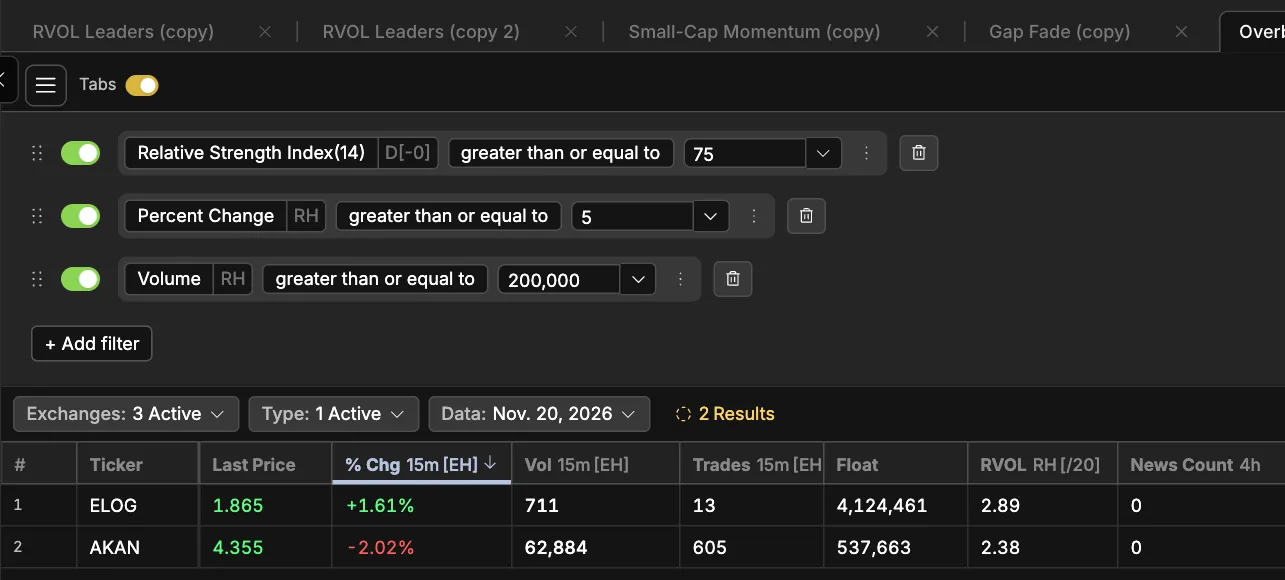
Where the numbers come from. The scan list and both charts are Scanz captures. The 5-minute bars, VWAP and the daily closes are public consolidated data (Yahoo Finance), with VWAP computed from it; the two sources differ by a few cents on some bars. The halt times are from Nasdaq’s public halt feed.
AKAN: the run
| Day | What happened (public daily bars) |
|---|---|
| Nov 12 | Closed at $0.672. |
| Nov 13 | Traded as high as $1.70 and closed at $1.36, up 102%, on 89 million shares. |
| Nov 16 | Closed at $2.21. |
| Nov 17 | Closed at $2.05, the first close under the day before. |
| Nov 18 | Ran to $4.67 in the last hour and closed at $4.03: up 500% from the Nov 12 close in four sessions. RSI(14) at the close: 81. |
| Nov 19 | Opened at $3.77, under the Nov 18 close, never got back above it (high $3.84), fell to $2.73 by 13:35 and closed at $3.43. The first red day by Sykes’s definition: the first close under the open since the run began. The drop of more than 10% from $4.03 also put it under the SEC short-sale rule for the rest of Nov 19 and all of Nov 20. |
| Nov 20 | Gapped up pre-market, opened at $4.86, 42% above the Nov 19 close, and traded to $5.60. |
A trader who shorted the November 19 retest of the morning high with a stop just above $3.84 had the stock trade under $2.80 that afternoon. A trader who held that short overnight opened November 20 a dollar through the stop.
AKAN on November 20, bar by bar
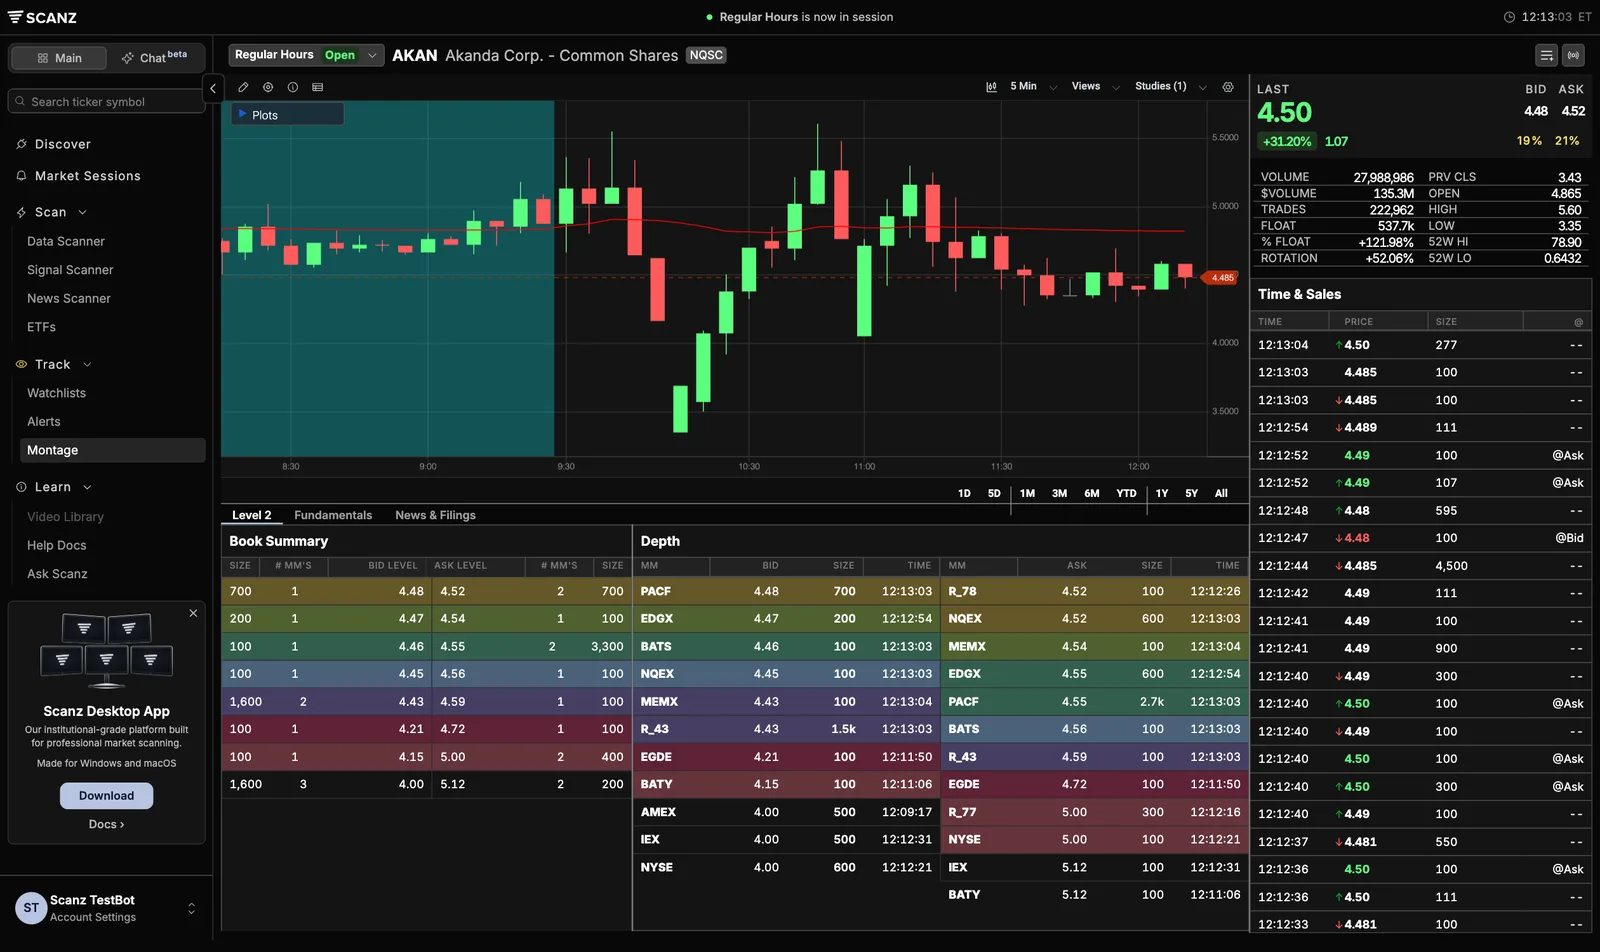
| Time (ET) | What happened (public 5-minute bars; Nasdaq halt feed) |
|---|---|
| 9:30 | Opened $4.86, ran to $5.35 in the first bar on 19 million shares. |
| 9:40 | Broke the opening high to $5.54 and closed the bar at $5.135, under $5.35. Failed high-of-day break. |
| 9:45 | Fell to $4.64. |
| 9:48 to 10:24 | Three limit-up/limit-down pauses: 9:48:21 to 9:58:21, 9:58:44 to 10:18:41, and 10:19:02 to 10:24:02. Low of the day, $3.35, in the seconds between the last two. |
| 10:20 to 10:40 | Squeezed back from $3.35 through VWAP (about $4.93); another pause 10:31:30 to 10:36:30. |
| 10:45 | New high of day, $5.60, six cents over the 9:40 high; the bar closed at $5.265, under $5.54. Failed high-of-day break. |
| 10:50 | Traded up to $5.49, a lower high under $5.60, then fell to $4.76 and closed there, under VWAP ($4.96). The crack. Paused again 10:52:00 to 11:02:55. |
| 11:03 to 11:05 | Reopened near $4.05 and bounced to $5.06, through VWAP, then closed the 11:05 bar at $4.92, two cents under it. Trigger 1 for the lower-high short, seven minutes after a halt. |
| 11:10 | Ran to $5.30 and closed $5.15, back above VWAP, but under the $5.49 lower high. |
| 11:15 | High $5.26, closed $4.74, under VWAP ($4.94). The bounce had stopped at $5.30, 30 cents under the day’s high. Trigger 2. |
| 11:20 to 12:30 | Lower highs: $5.07, $4.84, $4.69, $4.60. Low $4.06 at 12:30. |
| 12:35 to 15:55 | No 5-minute close back above VWAP (about $4.83 by the end). Closed the day at $4.20, up 22%. |
The lower-high short on AKAN, in R.
| Card | Entry | Stop | What happened | Result |
|---|---|---|---|---|
| Lower-high short, trigger 1 | $4.92 (11:05 close) | $5.50 | Skipped: trading had resumed from a halt 7 minutes earlier. Taken, half would have come off at 1R ($4.34) in the 11:35 bar and the rest at the $4.20 close. | 0 (+1.12R if taken) |
| Lower-high short, trigger 2 | $4.74 (11:15 close) | $5.50 | Skipped: the stop is 16% above the entry, past the 15% limit. | 0 |
The card took no trade on AKAN, and here its skips cost it. The halt rule kept it out of the first trigger, which would have made +1.12R, and the second trigger’s stop was too far away to size. That is the trade the two skips make: they give up days like this one to stay out of the reopening that gaps through the stop. One stock on one day is an illustration, not a record; the test below runs the card on 52 sessions.
ELOG: the runner that kept running
ELOG passed the same three rules at the same minute, and it never turned. It closed November 19 at $1.45, up 46%, opened November 20 at $1.50 and climbed all morning in small steps. In the public data two thin bars closed a cent or two under VWAP, at 10:00 (on 584 shares) and 10:05; from 10:10 on, every 5-minute bar closed above it, and the day’s high kept rising, to $1.93 at 11:55.
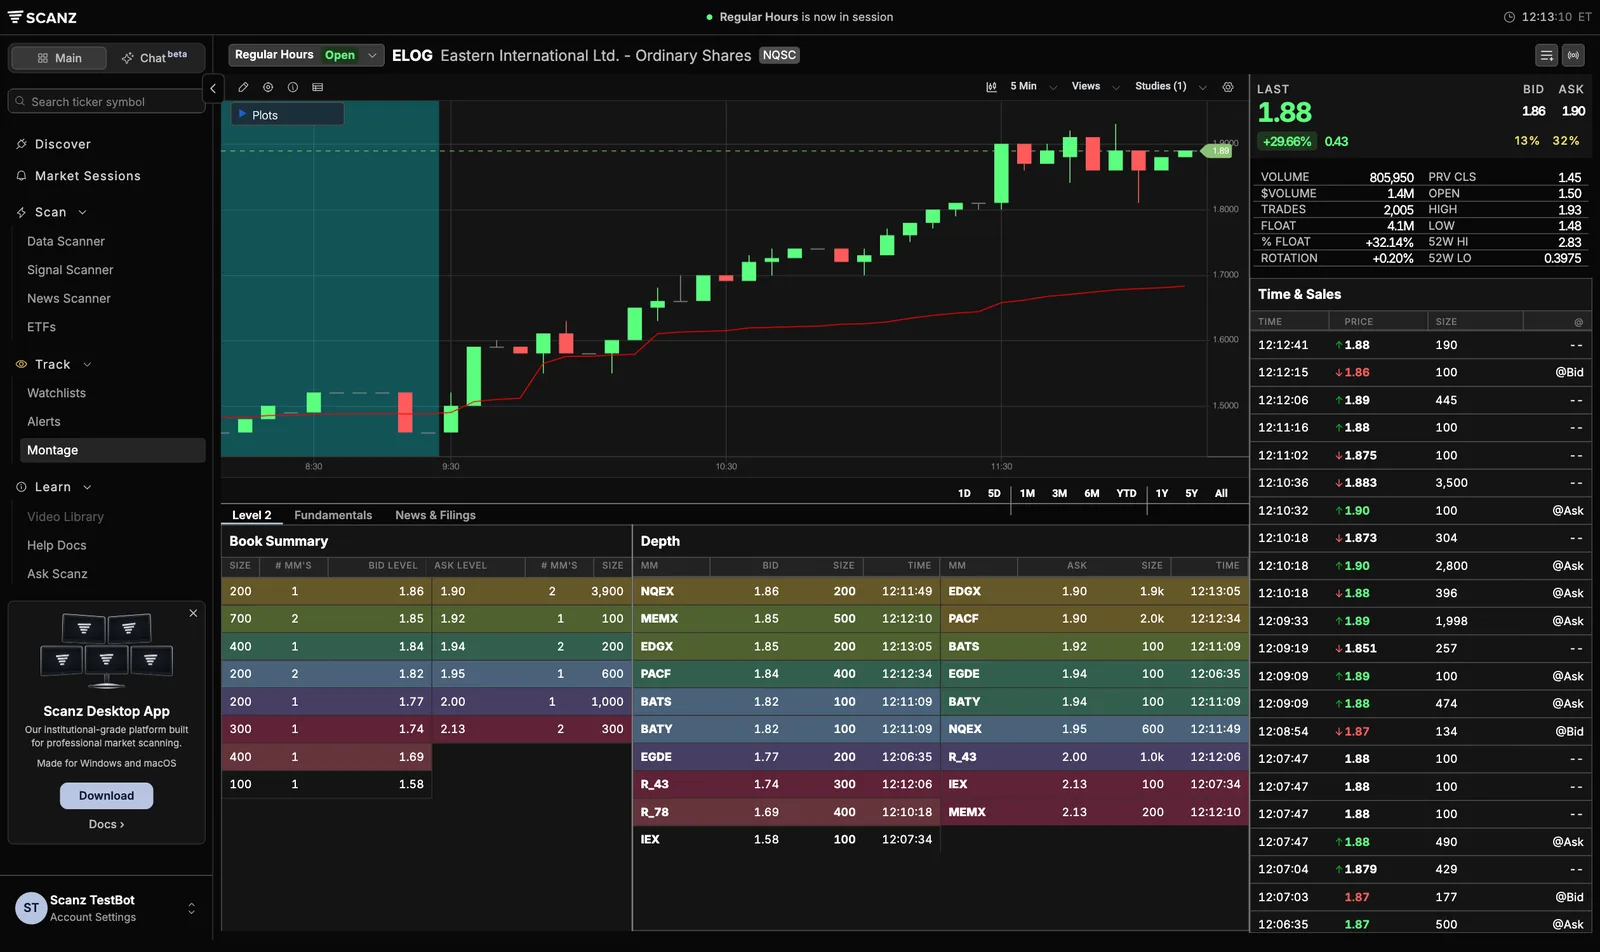
Nothing in the scan row separates ELOG from AKAN: both overbought, both up about 30% on the day. The chart does. A short of ELOG because it was “extended” was a short of a stock with no crack, no lower high and a rising VWAP. The lower-high card never triggers on it; the failed high-of-day break shorted it twice, as its section shows.
Does it work? Both short cards on 52 sessions
One stock on one day proves nothing, so we ran both short cards on public data. The main card was tested as first drafted, taking stocks of any price; its $1 to $20 limit came out of this test, as the end of this section explains.
How the test was run. Public 5-minute bars (Yahoo Finance) for 281 stocks that had been on Scanz scans in September to November 2026, every regular session from August 28 to November 19, 2026. A stock-session counted when, at some 5-minute close, it met the template’s three rules as we computed them from that data (daily RSI(14) with the bar’s price as today’s close at 75 or more, up 5% or more, 200,000 shares since 9:30), was $1 or more, and met the card’s run rules: at least three times its lowest close of the previous 20 sessions (one and a half times for stocks over $20), on at least the third session after that low. Then each card’s trigger, entry, stop, targets, 15% stop limit and two-attempt limit were applied bar by bar. 52 stock-sessions qualified. These are not Scanz captures, and the stock list leans toward recent movers.
| Card | Trades | Wins / losses / scratches | Total | Per trade |
|---|---|---|---|---|
| Lower-high short, $1 to $20 (the card as written now; in-sample) | 7 | 4 / 2 / 1 | +1.67R | +0.24R |
| Lower-high short, all prices (first draft) | 19 | 7 / 11 / 1 | −5.83R | −0.31R |
| Lower-high short, all prices, with the halt skip | 18 | 6 / 11 / 1 | −6.33R | −0.35R |
| Lower-high short, stocks $20 and over | 12 | 3 / 9 / 0 | −7.50R | −0.63R |
| Failed high-of-day break | 47 | 19 / 28 / 0 | −12.95R | −0.28R |
| Failed high-of-day break, with the halt skip | 43 | 19 / 24 / 0 | −8.95R | −0.21R |
Read the first row with its caveat: the $1 to $20 limit was chosen after seeing these results, four of the seven trades are one stock (NCPL), and one +2.2R trade is more than the whole total. Without it the other six lose 0.53R. The main card’s positive total comes from one stock, so this is a small sample, not evidence of an edge.
Every trade the main card took in its first draft; the seven marked ✓ are the ones the card as written now would take:
| Stock | Date | Trigger (ET) | Entry | Stop | Risk | Result |
|---|---|---|---|---|---|---|
| NWGL ✓ | Sep 2 | 12:00 | $1.26 | $1.32 | 5.0% | −1R |
| NCPL ✓ | Sep 2 | 13:20 | $1.01 | $1.16 | 14.9% | −0.03R (covered 15:55) |
| MEDS ✓ | Sep 16 | 13:55 | $6.00 | $6.26 | 4.3% | −1R |
| NCPL ✓ | Sep 24 | 10:25 | $1.45 | $1.59 | 9.7% | +0.5R |
| NCPL ✓ | Sep 25 | 10:00 | $1.52 | $1.64 | 8.3% | +0.5R |
| NCPL ✓ | Sep 25 | 13:25 | $1.52 | $1.57 | 3.3% | +2.2R (rest covered at $1.35, 15:55) |
| PENG | Oct 7 | 10:45 | $73.13 | $74.23 | 1.5% | −1R |
| PENG | Oct 7 | 11:30 | $73.06 | $73.61 | 0.8% | −1R |
| AEHL | Oct 14 | 12:45 | $23.39 | $25.57 | 9.3% | −1R |
| SGRY | Oct 26 | 10:05 | $23.00 | $23.15 | 0.7% | −1R (inside a halt window) |
| IBTA | Nov 3 | 13:45 | $61.90 | $63.20 | 2.1% | +0.5R |
| CHSN ✓ | Nov 4 | 12:40 | $3.97 | $4.38 | 10.3% | +0.5R |
| SGRY | Nov 9 | 10:35 | $25.95 | $26.02 | 0.3% | −1R |
| SGRY | Nov 9 | 11:15 | $26.12 | $26.43 | 1.2% | −1R |
| OMH | Nov 10 | 14:25 | $42.46 | $48.65 | 14.6% | +0.5R (inside a halt window) |
| DCTH | Nov 11 | 10:15 | $21.58 | $21.84 | 1.2% | −1R |
| DCTH | Nov 11 | 11:25 | $21.68 | $21.76 | 0.3% | −1R |
| LFTO | Nov 13 | 10:25 | $22.99 | $23.93 | 4.1% | −1R |
| LFTO | Nov 13 | 12:05 | $23.07 | $23.56 | 2.1% | +0.5R |
What the test says:
- Neither short card is an edge as written. Both lost over the sample. This page teaches the play traders take and its rules, not a system we measured to win, and 19 trades are too few to call it either way.
- The main card’s only positive group was the stocks this page is about. Under $20, the low-priced runners up several hundred percent, it made +1.67R over seven trades, and one NCPL trade made more than all of that. Most of its losses were stocks over $20 up 50% to 80% (PENG, SGRY, DCTH, LFTO), where the bounce under VWAP was a few cents and the stop sat 0.3% to 4% away. On a stock that is not really parabolic, a lower high is just noise.
- The early short lost more, and halts caused part of it. Four of the failed high-of-day break’s losses came inside halt storms, three of them on OMH, which ran from a $7.36 close on November 6 to $85.97 on November 9 and $94.60 on November 10. The 15-minute halt skip removed all four.
- The biggest collapses never triggered the patient short. OMH traded as high as $85.97 on November 9 and closed at $25.84 without a 5-minute bounce that met the trigger. AKAN’s own November 18 never closed under VWAP after its high. The lower-high short gives up the days that go straight down.
- What changed after the test. The main card now takes only stocks priced $1 to $20. Its +1.67R over seven trades is the sample that rule was chosen from, so read it as in-sample, not as a forward result, with the NCPL caveat above. The sample says the card is not obviously broken on the stocks it is meant for; it does not say the card wins.
- What did not change. Covering the whole position at the first 5-minute close back above VWAP, before 1R as well as after (Kullamägi’s stop on a failed-VWAP short), cut the loss across all prices from −5.83R to −2.02R, nearly all of it on stocks over $20. Under $20 it made +1.22R over eight trades against +1.67R over seven as written, so the card keeps half at 1R and the VWAP exit for the rest.
Limits. No slippage, borrow fees or short-sale restriction were modelled; a fill at the exact limit price is assumed. Where a stop and a target fell inside the same 5-minute bar, the stop was counted first. Minute-level halt data starts on October 22, so halts before that date could not be checked. Yahoo’s bars have gaps on thin names.
November 20, after the close: a session the test never saw. We ran both cards, unchanged, on the November 20 session once it was over. Two stocks qualified, AKAN and ELOG. The main card took no trade: its two AKAN triggers were skipped, one for the halt rule and one for the 15% stop limit (without the halt rule, the first would have made +1.12R). The failed high-of-day break took three trades for +0.43R: +0.5R on AKAN, then −1R and +0.93R on ELOG. One session adds nothing you can call a record.
Shorting the first red day or a failed high-of-day break
The early short has two versions, one on the daily chart and one intraday.
The first red day, as Tim Sykes teaches it. On his site a red day is a day that closes below its opening price, and the first one after a run of green days is the setup; he stresses that the more overextended the run, the better it works. His entry is a short near overhead resistance, where earlier buyers want out at break-even, with a stop just above that resistance, and he calls cutting losses quickly his first rule. Other traders draw the red line at yesterday’s close instead of today’s open: Alex Temiz, in TradeZella’s write-up, shorts the break below the prior close after at least three strong days and cuts the trade if the stock gets back above it.
The failed high-of-day break, intraday. The stock breaks the day’s high and the bar closes back under it: the buyers who chased the break are trapped. The high-of-day momentum guide teaches the same break from the long side; this is what it looks like when it fails.
The setup on one card
- The stock
- On the Overbought & Extended list, on at least the third day of the run, $1 or more
- Trigger (failed high-of-day break)
- A 5-minute bar trades above the day's high and closes back under it
- Trigger (first red day, Sykes)
- The stock trades below today's open after a run of green days; short the bounce into the open or the morning high
- Entry
- Short at the trigger bar's close (failed break), or on the bounce into resistance (first red day), with a limit order
- Stop
- A cent above the new high (failed break), or just above the resistance (first red day)
- Targets
- Half off at 1R, stop on the rest to the entry, the rest covered at the first 5-minute close back above VWAP or at 15:55 ET
- Skip it when
- It is the first day of the run; the stock is halted or has halted in the last 15 minutes; you would hold it overnight without a plan for a gap up; your broker has no shares to lend
The trade-off is plain: the stop is tighter and the entry is closer to the top, and more of these get run over, because the stock has not yet shown it can lose VWAP. A first red day held overnight can also gap straight through the stop the next morning, which is what AKAN did on November 20.
The failed high-of-day break on AKAN, November 20 (the same public 5-minute bars and halt feed as the example above):
| Trigger | Entry | Stop | What happened | Result |
|---|---|---|---|---|
| 9:40 bar: high $5.54 over the $5.35 opening high, closed $5.135 | $5.135 | $5.55 | Half at 1R ($4.72) at 9:45. The rest, stop at entry, sat through three halts while the stock fell to $3.35 and squeezed back, and was stopped at $5.135 in the 10:40 bar. | +0.5R |
| 10:45 bar: high $5.60 over the $5.54 high, closed $5.265 | $5.265 | $5.61 | Skipped: trading had resumed from a halt 14 minutes before. Taken, it would have reached 1R ($4.92) at 10:50 and been stopped on the rest at $5.265 in the 11:10 bar. | 0 (+0.5R if taken) |
And on ELOG, the runner that never turned, the same card shorted twice. The 11:10 bar traded to $1.80 over the $1.78 high and closed at $1.7799, a hundredth of a cent under it: a trigger on paper. The stop at $1.81 went in the next bar: −1R. The 11:55 bar made the day’s high, $1.93, and closed at $1.87. Half came off at 1R ($1.80) when the stock dipped to $1.75 at 14:50, and since the stock was above VWAP the whole time, the rule for the rest covered it in the same bar at $1.81: +0.93R. Two trades, net −0.07R, on a stock that closed at $1.89, near its high.
The 9:40 short spent half an hour locked in halts with no way out. It came out ahead because the stock reopened lower; on a day it reopens higher, the same halt takes the stop with it.
Staying long and trailing
Traders who are already long a parabolic runner treat the turn as their exit, not their entry. The scan is a list of stocks to manage, not a list to buy: a stock already on it is extended, and a new long there is buying from the people taking profit.
The trailing rules traders publish:
- Ross Cameron sells half at his first profit target and moves his stop to his entry; if he has not sold half, the first candle to close red is his exit signal, and an extension bar makes him start locking in profit (Warrior Trading’s momentum strategy).
- Kristjan Kullamägi, on multi-day moves, sells a third to half of the position after three to five days, moves the stop to break-even and trails the rest with the 10-day or 20-day moving average, selling on the first close below it (his setups).
The setup on one card
- Who
- Traders already long from the breakout, not new buyers
- Intraday trail
- Stop under the low of the most recent higher low on the 5-minute chart; out on the first 5-minute close under VWAP
- Multi-day trail
- Sell a third to half after three to five days up; trail the rest with the 10-day moving average and sell on the first close under it
- Take profit into
- An extension bar: a bar far bigger than the ones before it, on the biggest volume of the move
- Never
- Add to the position after the first close under VWAP
How does the trade change with price, float and time of day?
- Under $5 and floats under 10 million shares. The biggest runs and the most halts. Size for the halt, not the stop: a pause can reopen 10% to 20% away.
- Stocks over $20. They rarely go up several hundred percent, so the published versions use smaller lines: Stamatoudis wants about 100% for a mid cap and 50% for a large cap. In the test above, the lower-high short on these stocks lost 7.5R over 12 trades, because the bounce under VWAP was a few cents and so was the stop. If you trade them, give the stop more room than the lower high and size down to match; that is a different card from the one on this page.
- The morning turn and the afternoon fade. AKAN made its high at 10:45 and its turn took the next half hour. A stock that is still making highs after 14:00 is the late-day squeeze case: the window closes at 15:00 for new shorts because there is too little time left for the rest of the position to work.
- The multi-day version. Kullamägi’s parabolic short is a daily-chart trade: entries on the opening range low or a failed VWAP bounce, with the target at the 10-day and 20-day moving averages, where he says these stocks usually bounce. It is the same idea held for days instead of hours.
- A short-sale-restricted day. The day after a 10% drop, shorts fill only on an uptick. Limit orders at the trigger price fill on bounces, which is when this card shorts anyway; chasing a falling stock with a market order does not work.
Why do parabolic shorts fail, and what can’t the scan see?
Extended can always get more extended. These runners kept going long after they looked overbought:
- GameStop, January 2021. On January 13 it rose as much as 94% intraday and closed at $31.40, with short interest at 138% of shares outstanding the month before (Fox Business). It traded as high as $483 on January 28, about 15 times that close eleven sessions later (Wikipedia, with its sources). Prices before the 2022 four-for-one split.
- AMTD Digital, July to August 2022. It listed on July 15 at $7.80 and closed its first day at $16.81, up 108% (IPO Scoop). On August 2 it traded as high as $2,555.30 (Caixin), about 150 times the first day’s close, twelve sessions later.
- Volkswagen, October 2008. After Porsche disclosed control of about 74% of the shares on October 26, with about 12% of the shares sold short, the stock went from €210.85 to over €1,000 in under two days, then fell 58% in four (International Banker). A large cap, but the same mechanics.
- AKAN, November 20, 2026. Its first red day on November 19 was a good short until the close, and it opened the next morning 42% higher.
- ELOG, the same day. Overbought, on the list, and trending the whole morning.
What the scan and the rules cannot see:
- The turn itself. The template lists extension; the turn is on the chart. The card’s trigger exists because the list alone is never a reason to short.
- Borrow. No borrow-fee, hard-to-borrow or locate data in Scanz. A runner with no shares to borrow is not tradable on the short side, however good the chart.
- Halts. Scanz has no halt data, and halts are what make stops on these stocks unreliable.
- Squeeze fuel. A heavily shorted runner can run further on short covering; the short squeeze guide covers the short-interest filters Scanz does have.
- News. A buyout or an approval can turn a parabolic chart into a new price level. Read the headline before the chart.
- Offerings. A company can sell stock into the run, which often ends it, but the timing is not on the chart.
Questions traders ask
What is a parabolic stock?
A stock whose rise gets steeper as it goes, so each day or bar gains more than the last and the chart curves upward. In day trading the term usually means a small cap up several hundred percent in a few sessions. Traders who short them use thresholds such as 300% or more for small caps (Kristjan Kullamägi) or 200% from the last 20-day moving average touch (Marios Stamatoudis).
What happens when a stock goes parabolic?
It usually ends with a sharp reversal, but not on a schedule. The buyers who drove it run out, it loses VWAP and makes lower highs, and the drop can give back a large part of the move in days. Some runs go much further first: GameStop rose about 15 times from a day that already looked extended in January 2021.
Should you buy or short a parabolic stock?
Traders do both, at different times. Those already long hold and trail a stop under the move; those who short wait for the turn, a failed high and a close under VWAP, rather than shorting strength. A new long on a stock that is already on the overbought list is buying from the people taking profit.
What is the first red day?
Tim Sykes's name for the first day a stock closes below its opening price after a run of green days. He shorts it near overhead resistance with a stop just above that level. Other traders define the red line as yesterday's close instead of today's open.
How do you know when a parabolic stock has topped?
You don't know in advance; you see it after. The signs are a failed break of the day's high, the first 5-minute close under VWAP, and a bounce that stops under the high. On November 20, 2026, AKAN showed all three between 10:45 and 11:15 ET.
Where do traders put the stop on a parabolic short?
Above the high that proves the idea wrong: the day's high for an early short, the lower high for the patient short. A halt can reopen past any stop, so size the position for that, not just for the distance to the stop.
Does a high RSI mean a stock will drop?
No. RSI above 70 is overbought by Wilder's definition, but momentum oscillators can stay overbought for a long time in a strong uptrend. The Overbought & Extended scan uses RSI to find stretched stocks, and the rules on this page wait for the chart to turn before shorting any of them.
Can you short a parabolic stock if it is hard to borrow?
Only if your broker can locate shares, and usually at a daily fee. SEC rules require the broker to have reasonable grounds to believe the shares can be borrowed before the short sale. Scanz does not show borrow availability or fees, so check with your broker before the trigger.