Volatile stocks that see large intraday price movements offer significant opportunities for traders. In this guide, we’ll show you how to find volatile stocks using Scanz.
What is a Volatile Stock?
Volatility is a measure of how quickly a stock’s price changes and the magnitude of those changes. So, volatile stocks are those that typically see large price swings and frequently set new highs and lows. In contrast, low volatility stocks tend to trade in a narrow range and rarely see price moves of more than 1-2%.
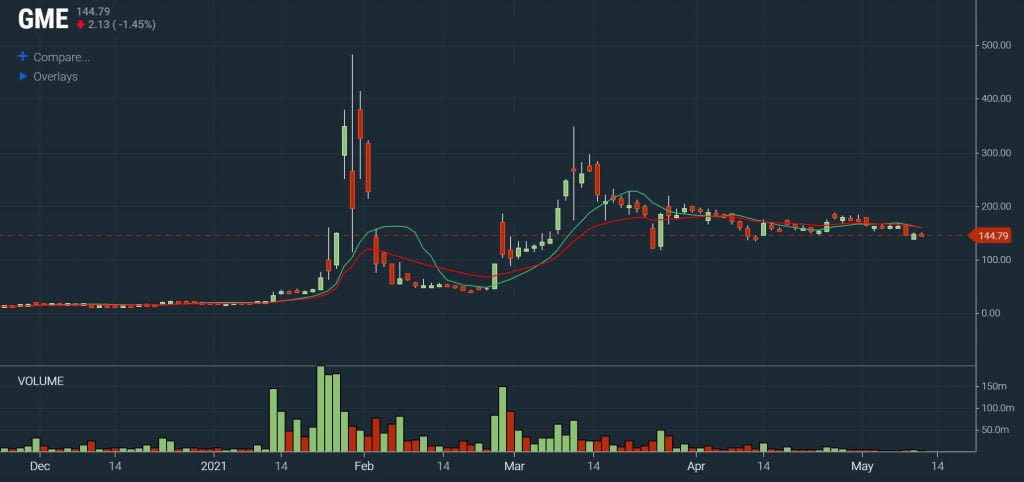
There’s no universally agreed-upon cutoff for how what price fluctuations are needed to call a stock ‘volatile.’ Generally, stocks that frequently see day-to-day movements of more than 2% or that vary in price by more than 10% per month are considered volatile. However, you can decide on your own cutoffs when defining volatile stocks.
Pros and Cons of Volatile Stocks
The reason that many traders are interested in volatile stocks is that they provide opportunities for trading. If a stock moves 5% in a day, that means that you have a potential upside of 5% from a single day trade. Intraday volatility also offers the possibility of repeated short-term trades to take advantage of each rise and fall.
However, with greater potential upside also comes more potential downside. For that same stock that moves 5% in a single day, traders you could lose 5% instead of gaining that amount. Volatile stocks can be difficult to time properly since they tend to move quickly, and you can suffer larger losses if you misjudge the market.
How to Find Volatile Stocks
Using a stock screener like Scanz is one of the best ways to find volatile stocks. Let’s take a closer look at how the process works.
Step 1: Define Your Volatility Threshold
To start, you need to define what constitutes a volatile stock for your own trading. As we mentioned, it’s up to you to decide whether a volatile stock is one that moves more than 5% a day, one that moves more than 10% a month, or something else entirely.
Think carefully about your own time horizon for trading. Swing traders might want to consider volatility on a weekly or monthly timeframe, while day traders will want to look at daily or even hourly price changes. You can also combine multiple timeframes, for example by defining a volatile stock as one that has moved at least 2% on the day of your scan and by at least 10% in the past month.
Step 2: Scan
Once you have a volatility threshold in mind, it’s time to build your scan. We’ll show you how to build a broad volatility scan using the Easy Scanner and a narrower scan using the Pro Scanner.
Easy Scanner
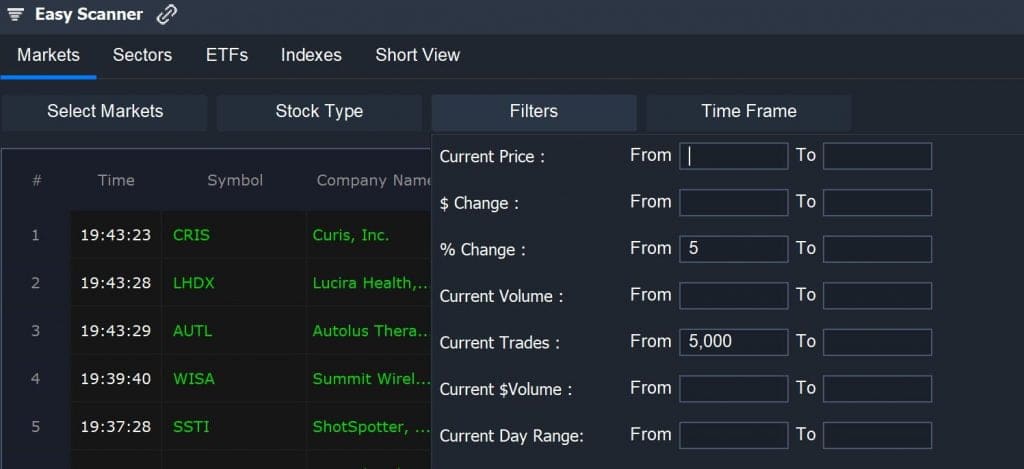
Scanning for volatile stocks with the Easy Scanner is simple. Just enter a threshold for the day’s percent change under the Filters menu, and the scanner will automatically display stocks that have moved by more than that amount since the market opened. It’s also a good idea to set a minimum dollar volume or number of trades, so that you’re only looking at stocks that are moving on high trading volume.
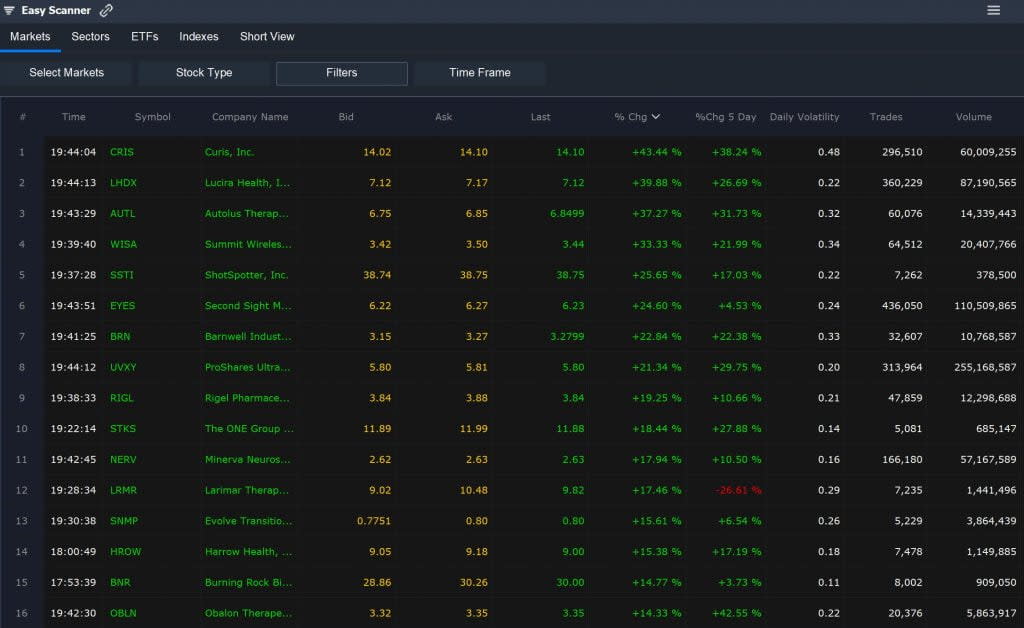
To organize the scan results, click the % Change column and sort stocks from greatest to least price change. You can also add columns to look at stocks’ 5-day percent change, percent off the 52-week high or low, or daily volatility.
Pro Scanner
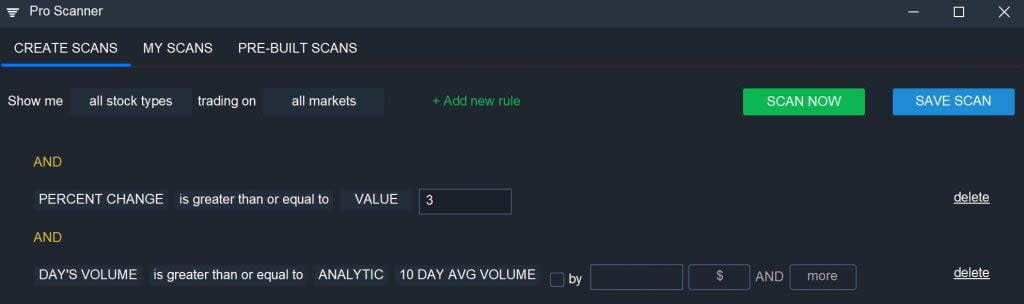
With the Pro Scanner, you have more control over defining your volatility and volume thresholds. To start, add a rule defining your volatility threshold. To find stocks that have moved at least 3% since market open, for example, you can use:
PERCENT CHANGE is greater than or equal to VALUE 3
To limit your scan to stocks that are also trading with above-average volume, you can use a rule like:
DAY’S VOLUME is greater than or equal to ANALYTIC 10 DAY AVG VOLUME
These rules give you a place to start, but you’re free to customize your scan with any additional parameters you like. For example, you can look for volatile stocks that are dropping below an RSI value of 30 to find stocks that are potentially oversold and could be poised for a reversal:
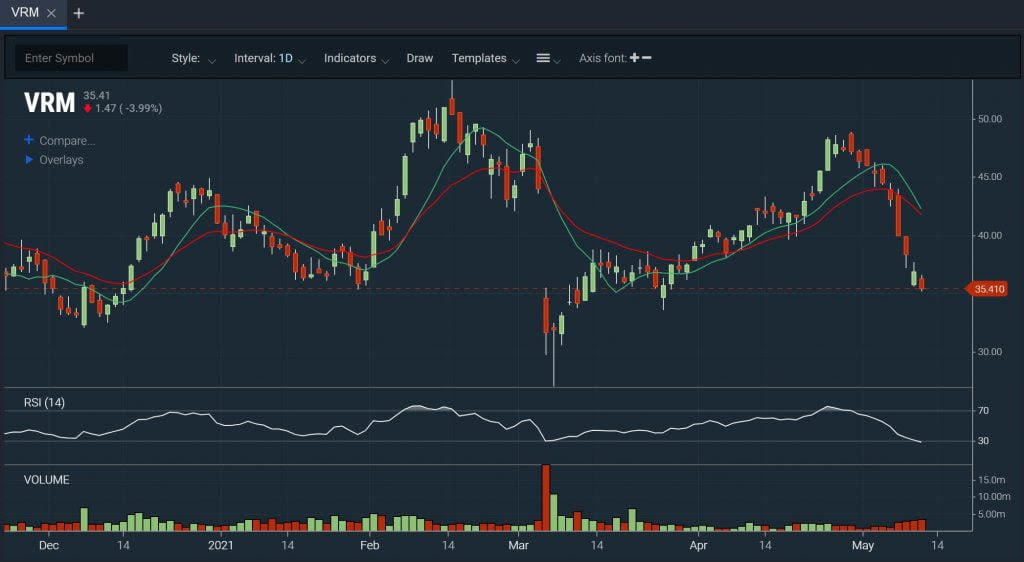
RSI – Relative Strength Index (Daily, 14) is less than or equal to VALUE 30
Alternatively, you can use a percent change threshold to scan for volatile stocks in the context of your favorite scan.
Conclusion
Volatile stocks offer more trading opportunities and potentially higher returns for day and swing traders. With Scanz, you can easily scan for volatile stocks using the Easy and Pro Scanners and customize your scans to suit any trading strategy.
Related Reading:
- How to Find the Hottest Stocks in Any Sector
- How to Scan for Short Squeezes
- Scanning for Stocks with Abnormal Volume
- 10 Powerful Scanz Features to Explore
Ready to start scanning? Try for free and choose the plan that fits your workflow.