Think fast!
Day traders constantly rely on their abilities to make decisions quickly and efficiently. When you spot that perfect entry on a stock you’ve been eyeballing for days, you don’t have any time to waste. Every second counts and every action must be precise. So, how exactly does a trader make an educated decision about buying or selling a company in such a short period of time? Isn’t it impossible to research a company that fast?
Yes and no. We all make rapid decisions daily whether we are conscious of them or not. We simplify seemingly complex situations by employing decision-making tools and strategies. In day trading, technical analysis is one of the most effective strategies for simplifying large amounts of data in order to ease the decision making process.
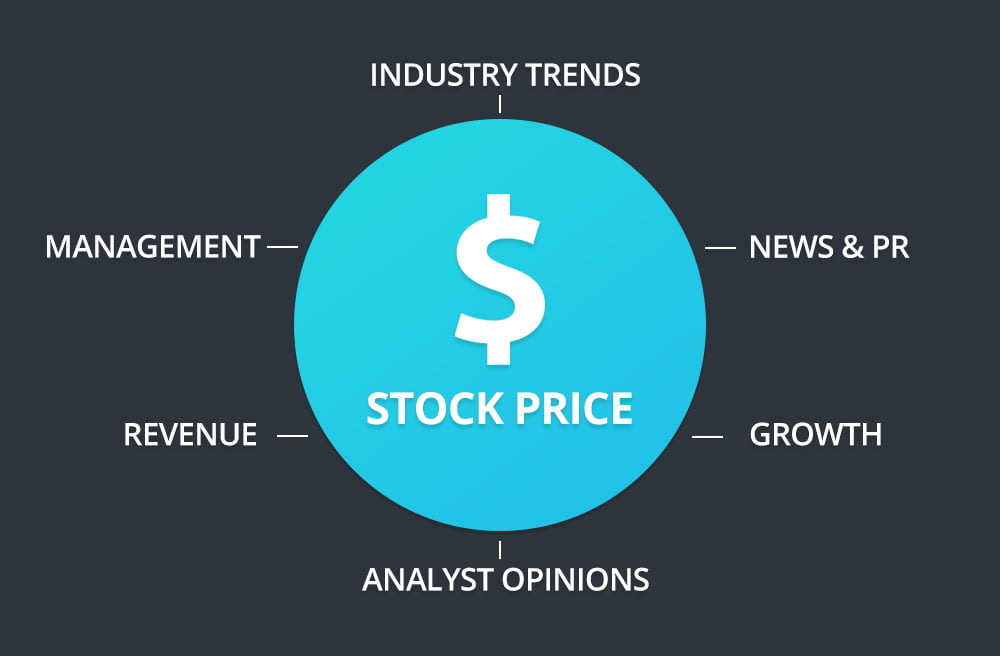
Technical analysis operates under the premise that a stock’s price movement accounts for all factors. Whereas investors may be focused on industry trends, company management, and accounting ratios, day traders focus primarily on price. This simplified form of analysis allows traders to make quick decisions that allow them to operate more efficiently.
This post assumes that you understand some basic technical analysis concepts and terms. We’ll start with some basic tips and move on to some more advanced tips. The following lessons can be applied to your technical trading strategy to help you improve your trading results.
Master Support and Resistance
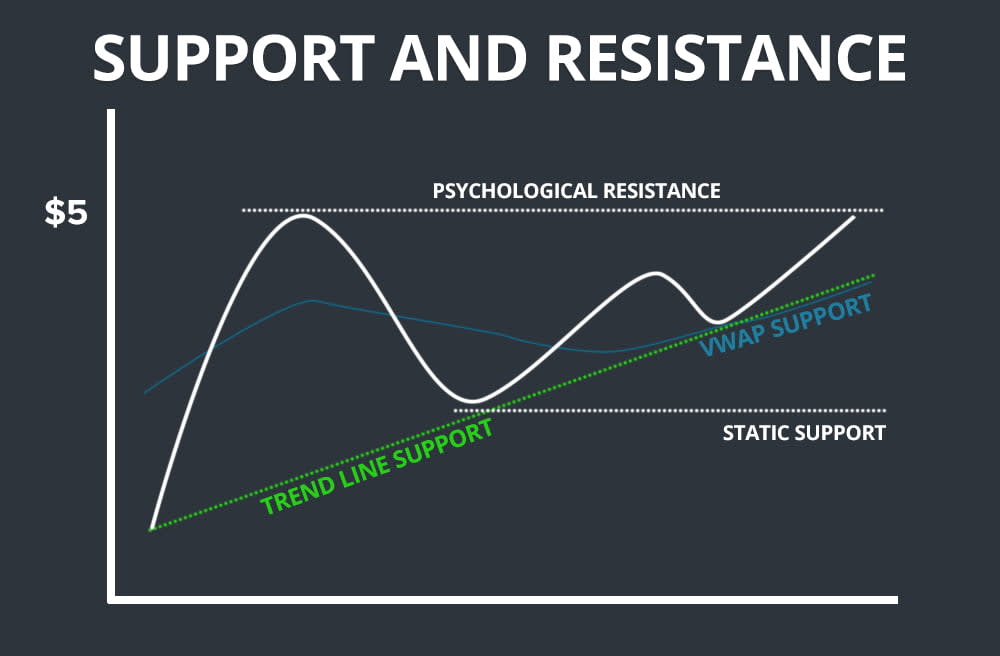
Support and resistance are arguably the most important components of technical trading. Support areas are prices where buyers tend to overpower sellers whereas resistance areas are prices where sellers tend to overpower buyers.
These price levels are what allow traders to gauge the potential risk and reward of a trade. The key is being able to measure them properly. You should also keep in mind that support and resistance levels are NOT guaranteed to hold.
Here are a few types of support and resistance levels to be aware of:
- Static Price Points – A static price point can be any number where a stock has historically shown support or resistance. These areas can be identified on a stock chart. For example, if a stock is always greeted with buyers at $4.30, that would be considered a support level.
- Psychological Price Points – Psychological price points are similar to static price points except they don’t require any historical confirmation. For example, a stock $98 stock may run into resistance at $100 due to the psychology surrounding the change in price. Psychological price points tend to exist at whole and half dollar marks.
- Trend Line Touches – A trend line is an imaginary line that is drawn to illustrate a stocks trend. Trend lines are drawn by connecting the highs or lows of a stock with straight lines. These lines can be used as support and resistance levels.
- Technical Indicators – Certain overlay technical indicators can be used as support and resistance levels. These indicators can reveal significant price points that otherwise wouldn’t be visible on a chart. For example, a stock may use it’s 200-day moving average as support.
Understand the Trend
A stock’s trend is the general direction in which the price is moving. The trend can go upwards, downwards or flat. Understanding a stock’s trend helps ensure you are on the right side of a trade. For example, if a stock is in a downtrend, it wouldn’t be wise to initiate a long position unless there are clear signs of a trend reversal.
It’s also important to account for time frames when analyzing trends. A stock can have different trends across different time frames and you need to pay attention to the trends that are most relevant to your trading style. For example, a stock may be in a yearlong uptrend, making for a nice investment opportunity. That same stock may be in a multi-day downtrend, making for a bad long-biased swing trade (or a good short opportunity).
Pay Attention to Broader Market Trends
Broader market sentiment can leak into individual stocks. Just like technical analysis is a tool for summarizing price factors, broader markets can summarize the activity of many individual stocks. Examples of broader markets include the S&P 500, DOW, and NASDAQ. If the NASDAQ is down 3% on the day, you may be more hesitant to anticipate the breakout of a tech stock.

Anticipation vs. Confirmation
When planning a trade, there are two basic approaches. You can anticipate a move or you can wait for *confirmation. *Both methods have their pros and cons. Anticipation can provide better entries with less certainty whereas waiting for confirmation provides higher certainty at the expense of a later entry.
Let’s use an example to illustrate the concept. A stock is trading at $9.50 with a 52-week high of $10.00. If you anticipate the breakout, you could enter at $9.50. If you wait for confirmation, you would have to enter at a price above $10.00. So, which is better?
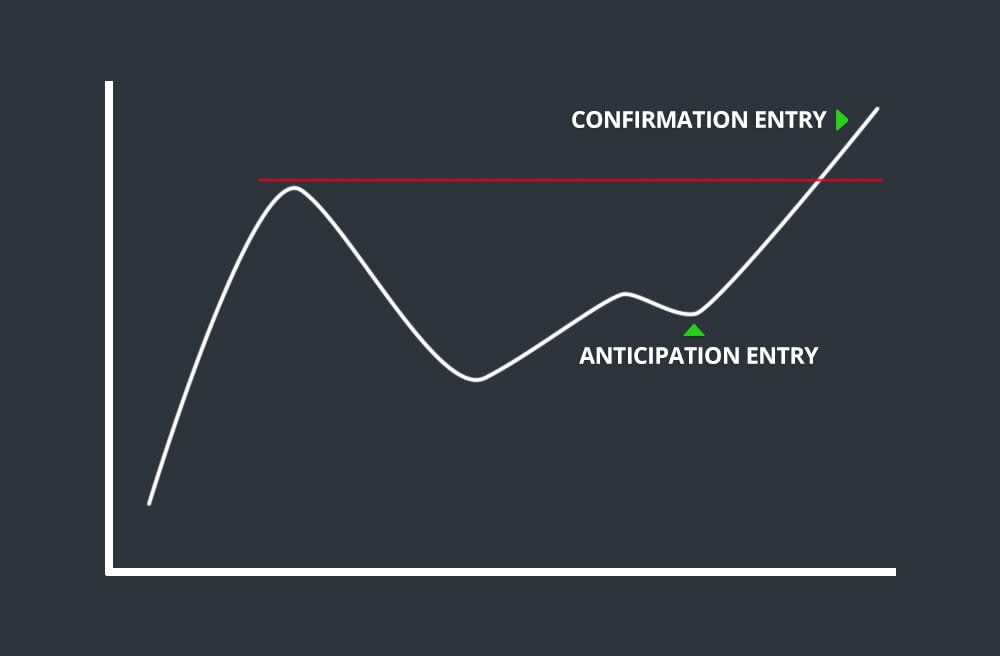
Unfortunately, there’s no definitive answer. As mentioned, there’s a trade-off between the two strategies. That said, it’s important to look at the trade as a whole. If the stock has support at $9.30, it may make sense to anticipate the move. If the stock has support at $8, you may want to wait for confirmation.
Use Different Timeframes on Your Charts
When you’re staring at your screens by yourself for hours, it can feel like you are operating in a silo. It’s important to be conscious of your trading environment. Stock market trading activity is contributed to by day traders, swing traders, investors, institutions, scalpers, and more. All of these different groups rely on different analytical tools. This is why it’s important to focus on the bigger picture. One of the ways you can do this is by analyzing charts across multiple timeframes.
Pay attention to intraday charts, hourly charts, daily charts, etc. This can help you identify significant price points and get a better understanding of the mentalities of other traders. For example, $5.30 may not be a significant price on an intraday chart, whereas it may have major significance on a daily chart.
Analyze multiple charts and try to understand the perspectives of different types of traders.
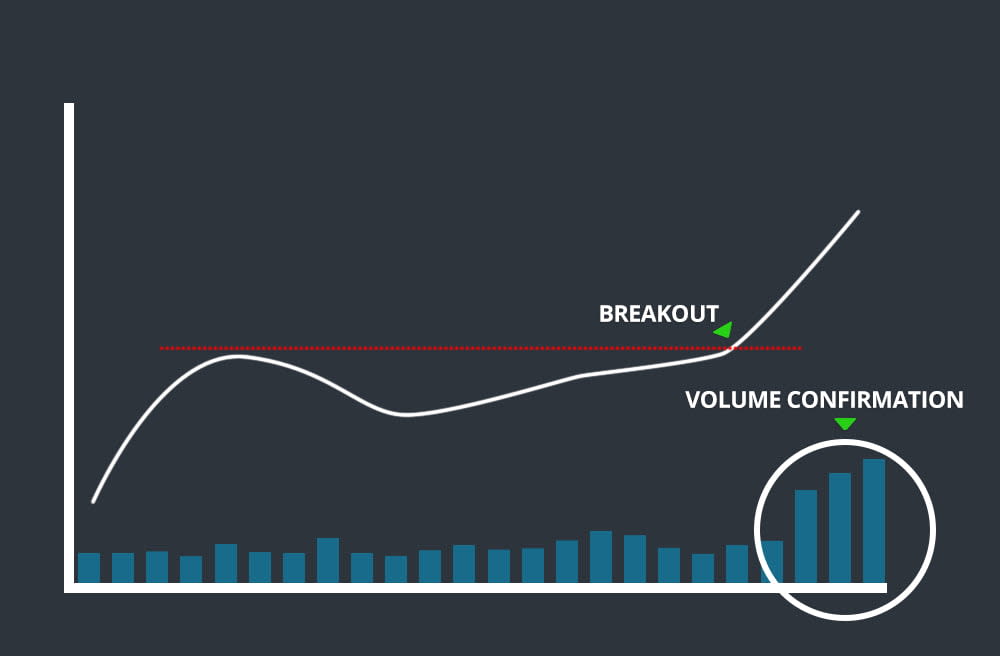
Volume is Crucial
Every trader is focused on price. In fact, most of us obsess about it. It’s important to follow the volume as well. Not only does volume increase liquidity (the ease with which you can buy/sell), but it also shows the true interest in a stock. High volume reflects high interest in a stock, making for better trading action.
Too Many Technical Indicators Become Redundant
We started this article by discussing the importance of efficient decision-making. Technical indicators can be used to support the decision-making process, however too many technical indicators can be inefficient and redundant. Remember, the majority technical of technical indicators utilize the same three inputs: volume, price, and time.
Traders need to be able to distinguish the difference between indicators that help and hinder your decision-making. Furthermore, indicators should be used to improve your strategy NOT rationalize decisions you’ve already made. If you need to reference the PSAR, MACD, RSI, Bollinger bands, and VWAP indicators before a trade, you’re not operating efficiently.
Limit your indicators and keep your charts clean.
Give Yourself Breathing Room
When you analyze numbers for a living, precision becomes a prime focus. After all, we are trying to measure the markets to the best of our abilities. While this approach is necessary for successful trading, it’s still important to give yourself some breathing room if you want to let your trades work. Not all price action is picture perfect*. *If you give yourself a range to work with (vs. a static price), the trade becomes less stressful and may work out in your favor.
For example, let’s say you buy a stock at $20.50 expecting support to be at $20. The stock pulls to $20, you get stopped out and the stock bounces off $19.95 before trending upwards. If you had given yourself more breathing room, the trade may have worked out in your favor.
Similarly, let’s assume another stock trading at $5.75 has intraday support at $5.50, $5.25, and $5. If you base your risk at $5.50, you give yourself $0.25 of breathing room. If you base your risk at $5.25, you have $0.50 of breathing room, which may be needed for the trade to work out. Of course, you would need to adjust your position size to keep your risk consistent.
These are hypothetical examples, but the broader lesson remains the same. Give yourself room for a trade to work. This does NOT mean you should increase your risk exposure on every trade. In fact, it’s just the opposite. The goal is to limit your risk by preventing you from stopping out of a trade too early.
Balance Risk and Reward
Traders often get compared to gamblers, and sometimes rightfully so. There’s an old joke that goes, “How do you end up with $1 million from trading? Start with $2 million.” Day trading has its inherent risks – gamblers ignore these risks while real traders mitigate them.
Your goal as a trader is to shift the odds in your favor. If you’re risking a dollar to make a dollar, the stock market has the same odds as a casino. If you’re risking a dollar to make four dollars, the odds have shifted in your favor. This may seem like poker table talk, but its far more analytical.
Technical traders can measure risk and reward by using support and resistance levels. If a stock is trading at $10, with support at $9 and resistance at $15, you can place a trade where you risk $1 to make $5.
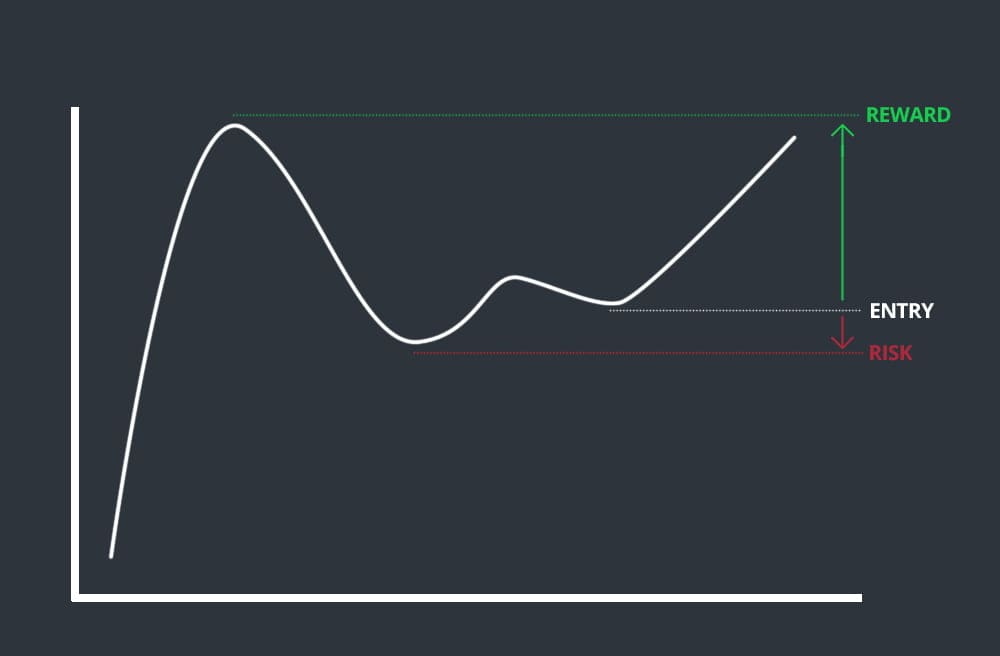
Focus on finding stocks with favorable risk/reward ratios (preferably above 3:1).
Don’t Be Completely Blind to Fundamentals
This entire post has been focused around technical analysis, but there is still value to fundamental analysis. It wouldn’t be feasible to apply fundamental analysis to every trade, but it’s important to be aware of some fundamentals.
Understanding fundamentals can help you gauge the legitimacy of certain price action. This allows you to create a well-rounded trading plan. For example, let’s assume you see a stock breaking out 50% on the day. You may want to understand the legitimacy of the move before deciding whether it is a short or long play. If the stock is breaking out because it doubled its earnings estimate, you may want to hold off on your short position. Contrarily, if the stock is artificially breaking out due to a paid promotion, you may take another approach.
It can be helpful to differentiate between legitimate and artificial price movement, even if your strategy is primarily technical.
Conclusion
Technical analysis is a skill that takes years to learn, apply, and refine. Predicting the market with 100% certainty is impossible, but good technical analysts can remain consistently profitable through a combination of their analysis and risk mitigation. Little tweaks in your strategy can yield major returns and there’s always something new to learn!
What are the best technical analysis tips you’ve learned? Share them in the comments!
Related Reading:
- A Beginner’s Guide to Technical Indicators
- Comprehensive Guide to Moving Averages
- Maximizing Profits and Minimizing Risk
- Dow Theory for Traders
- Using Market Internals to Improve Your Trading
Ready to start scanning? Try for free and choose the plan that fits your workflow.