tutorials
How to Set Up the Easy Scanner Like a Pro
Get the most out of the Scanz Easy Scanner with pro setup tips. Learn to configure filters, customize columns, compare sectors, and spot hot stocks at a glance.
5 min read
Read →
Strategies, setups, and platform guides from the Scanz team.
Get the most out of the Scanz Easy Scanner with pro setup tips. Learn to configure filters, customize columns, compare sectors, and spot hot stocks at a glance.
Discover how to find the top-performing stocks in any market sector using the Scanz Easy Scanner. Filter by industry, sub-sector, and real-time market data.
Get in early on short squeeze setups before the move happens. Learn what causes short squeezes, how to identify high short interest stocks, and how to scan in Scanz.
Find OTC penny stocks ready to move with targeted scanner setups. Learn the pros and cons of trading over-the-counter stocks and how to scan for them using Scanz.
Find trending stocks before they peak with the best momentum trading scans. Learn moving average stacks, volume filters, and breakout setups using Scanz.
Track institutional money with a block trade scanner. Learn what block trades are, how to spot large institutional orders, and how to set up the scanner in Scanz.
Identify stocks trading with abnormal volume before major price moves. Learn to use the Scanz Breakouts module and Pro Scanner to find unusual volume spikes fast.
Use market internal indicators to gauge overall market strength as a day trader. Covers volume spread, advance/decline data, and other key NYSE and NASDAQ internals.
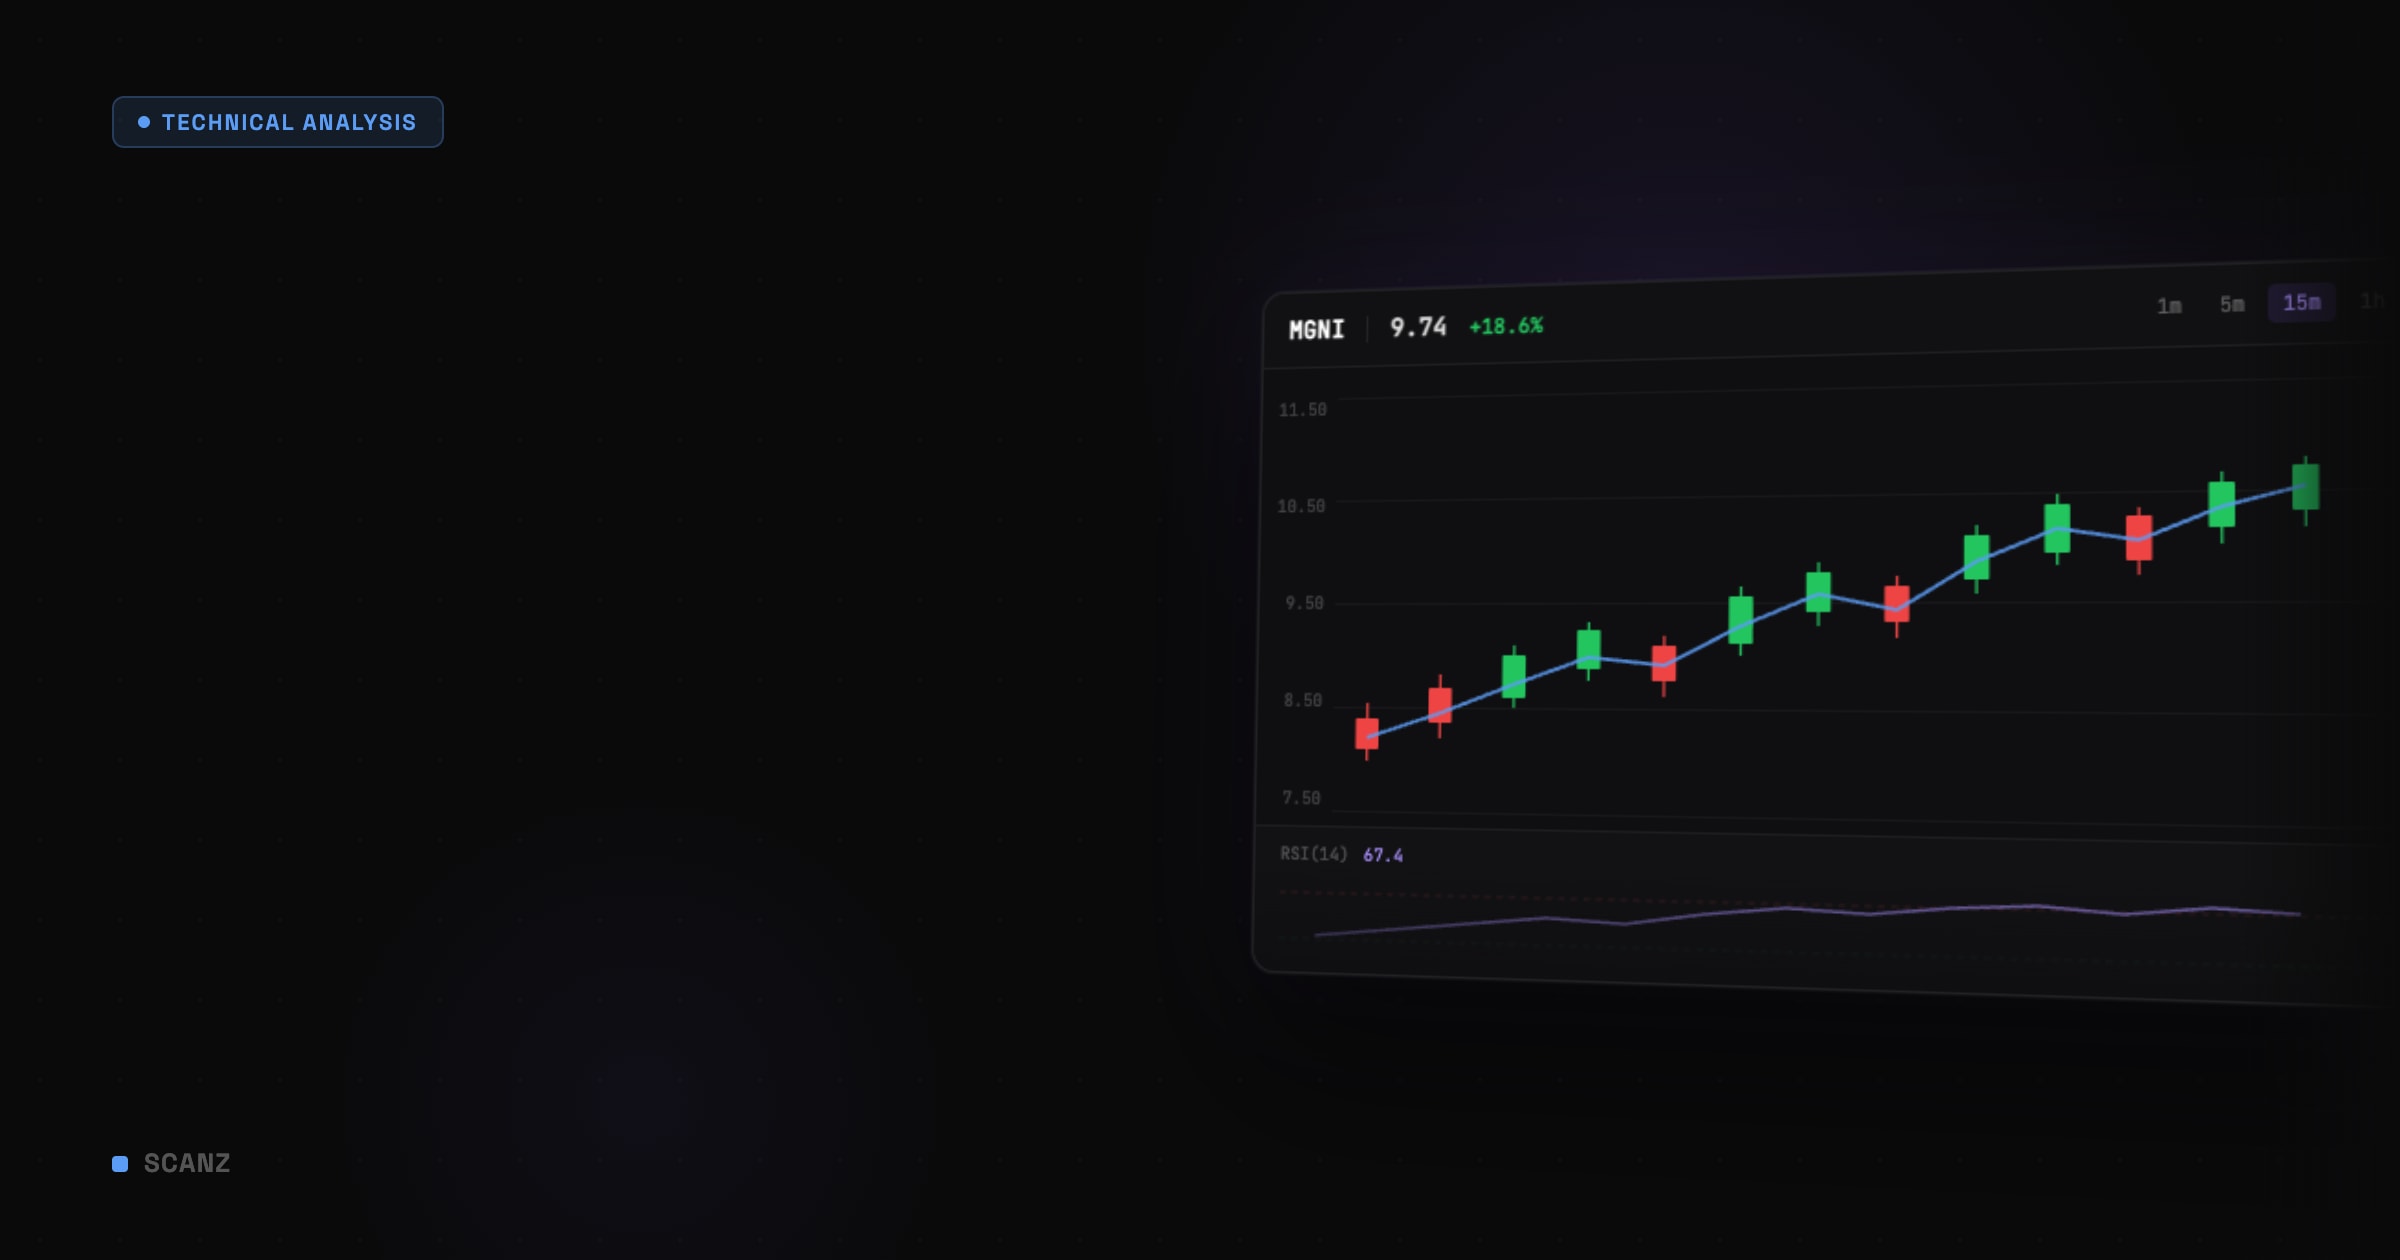
Learn how the RSI indicator works for stock trading. Understand overbought and oversold signals, RSI calculation, divergences, and how to scan with RSI in Scanz.
Showing 82–90 of 119 articles
Browse by tag