tutorials
Creating a Bollinger Bands Scan
Learn how to create a Bollinger Bands scanner using Scanz. Identify overbought and oversold stocks, volatility squeezes, and band breakout trading opportunities.
5 min read
Read →
Strategies, setups, and platform guides from the Scanz team.
Learn how to create a Bollinger Bands scanner using Scanz. Identify overbought and oversold stocks, volatility squeezes, and band breakout trading opportunities.
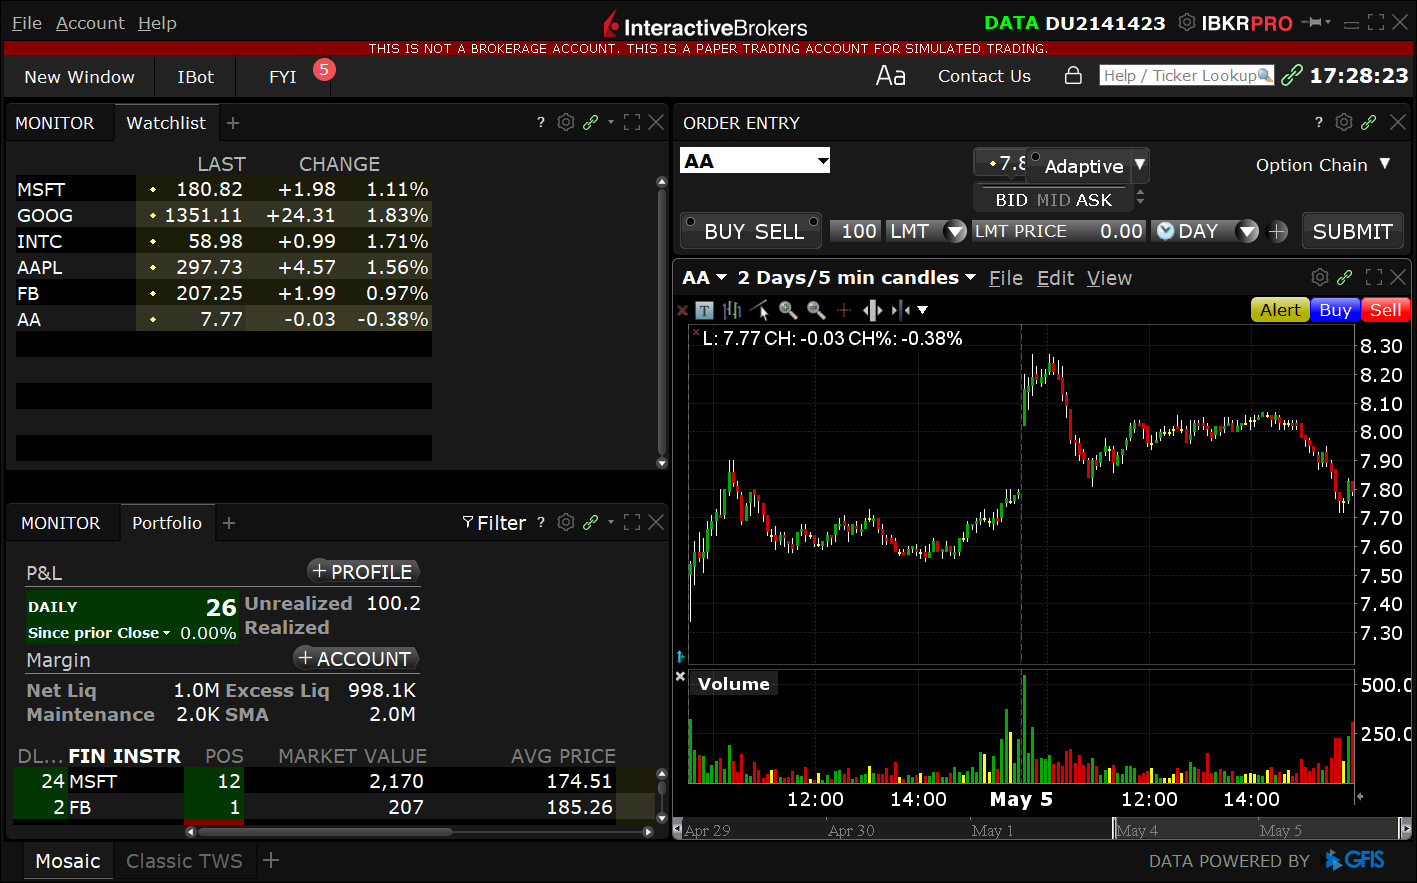
Step-by-step guide to connecting Scanz with Interactive Brokers. Route trades directly from your stock scanner to your IB account with seamless broker integration.
Build fundamental stock screeners in Scanz using key metrics like market cap, revenue, and debt. Combine fundamental filters with technical analysis for stronger trades.
Create a NASDAQ stock screener with Scanz to target top growth stocks on the exchange. Filter by volume, price action, and technical indicators for NASDAQ-listed equities.
Learn how to build an ETF scanner using Scanz Easy and Pro Scanners. Find tradeable ETFs by sector, volume, and price momentum to diversify your trading strategy.
Set up the Scanz Pro Scanner for trend following strategies using moving averages, ADX, and momentum indicators. Find strongly trending stocks and ride them for profit.
The ultimate guide to technical stock screeners: learn how to use price, volume, and indicator-based filters in Scanz to find high-probability trading opportunities.
Discover 3 powerful ways to scan for short selling opportunities using Scanz technical screens. Learn to identify bearish setups and hedge your portfolio.
Build a low float stock screener with Scanz to find high-volatility trading opportunities. Learn what low float means and how to filter for the best low float setups.
Showing 55–63 of 119 articles
Browse by tag